Research Article
The Utility of Computed Tomography in Estimating Ancestry
- Dr. Sandra Call, Ph.D, F-ABMDI *
MDI & Forensic Anthropology Services LLC, Belton, TX 76513 United States of America.
*Corresponding Author: Sandra Call, MDI & Forensic Anthropology Services LLC, Belton, TX 76513 United States of America
Citation: Call S. (2025). The Utility of Computed Tomography in Estimating Ancestry, Journal of BioMed Research and Reports, BioRes Scientia Publishers. 8(4):1-13. DOI: 10.59657/2837-4681.brs.25.191
Copyright: © 2025 Sandra Call, this is an open-access article distributed under the terms of the Creative Commons Attribution License, which permits unrestricted use, distribution, and reproduction in any medium, provided the original author and source are credited.
Received: July 21, 2025 | Accepted: August 04, 2025 | Published: August 11, 2025
Abstract
The following study investigated the utility of computed tomography (CT) for the estimation of ancestry in forensic anthropology. While the usage of three-dimensional replicas of skeletal material have increased across the field of forensics, there is currently minimal literature demonstrating the utility of skull replicas for data acquisition for the purposes of estimating ancestry by forensic anthropologists. This study tested the effectiveness of CTs for ancestral data acquisition used by forensic investigators. The empirical data collected from a sample of Computed Tomography (CT) scans from cadavers of known sex and ancestry were used to produce three-dimensional (3D) virtual replicas. The accuracy of using the replica to correctly classify decedents within the correct sex and ancestral group was determined. Discussed within this study are the ancestral data which was effectively and ineffectively obtained from the 3D representations. Applying a multi-methods research approach, including radiologic data collection, macroscopic and metric data collection techniques, and statistical analysis, advantages and limitations of CT data for ancestral acquisition were identified.
Keywords: anthropology; computed tomography; ancestry; forensic anthropology
Introduction
Forensic anthropologists are routinely consulted by law enforcement agencies to aid in the identification of unidentified human remains that are partially or completely skeletonized beyond recognition. When consulted, forensic anthropologists are asked to determine characteristics such as the age, race, sex, and living stature of the individual in question for comparison with those of missing individuals [1,2]; those components are known as the biological profile. As expert skeletal anatomists, they often respond to skeletal scenes to recover surface level scattered remains or to identify clandestine burial sites. Locating bodies under the surface requires a working knowledge of taphonomy (the process of decay), entomology (the study of insects), and the normative state of the environment. Safe recovery methods are vital to the preservation of skeletal material and to avoid any postmortem damage to the bones. Bones are typically evaluated at the scene to establish the minimum number of individual(s) (MNI) present at the scene. This helps the anthropologist determine if any commingling (mixing of human remains) protocols should be implemented. Traditional anthropological methodologies used to determine race and sex fall into two distinct but straightforward categories. Metric methods involve the collection of measurements from specific bones using specialized equipment such as sliding and spreading calipers, measuring tape, and osteometric boards. Given that metric methods produce quantifiable observations, error rates can be calculated to determine the reliability and precision of the methodology. The results are subjected to statistical analysis and are credited as being more repeatable than non-metric methods [1]. These techniques also require the observer to identify specific landmarks on the bone, conduct precise calculations, accurately interpret their findings and reach sound conclusions. Non-metric methods encompass the evaluation of specific bones using macroscopic examination. No specialized equipment or measuring devices are needed. Typically, a trait list is created that depicts specific morphological characteristics on the bone. The traits are listed as either present or not present. Features on the skeletal material were decidedly discrete with no intermediate expressions on the bone. In recent years, however, these trait lists have been reevaluated such as the traits of Phenice [3]. Phenice identified three characteristics on the pubis to accurately estimate biological sex that were either present or absent [3]. The presence of the traits is consistent with the female form while the absence is more consistent with the male form. The result was determined in a majority rule fashion resulting in an estimation of female if the two or more of the traits were present. Aside from determining the presence or absence of specified features, the overall shape or morphology of a bone is recorded since a specific shape is more consistent with a specific sex or race such as the shape of the orbits or nasal opening. Non-metric methods are often criticized as being subjective and imprecise [1,4]. Application of these methods requires extensive experience on behalf of the observer.
Non-Metric Estimation of Ancestry
Non-metric analysis relies exclusively on macroscopic visual assessment of skeletal traits. Historically, non-metric evaluation of skeletal material was often the preferred methodological approach to estimating ancestry due to its practicability. There are a number of macroscopic traits that demonstrate variation associated with ancestry and can be evaluated in degrees of expression, shape, frequencies, and presence or absence [2]; however, these techniques are vulnerable to subjectivity.
The Harvard list created by Dr. Earnest Hotoon in the 1930s identified many of the ancestral traits utilized today citing significant differences of the orbits, nasal opening, and hard palate [5]. Rhine tested the precision of the most widely applied non-metric traits for estimating ancestry using 87 skulls with known identities from the collection of the Maxwell Museum. Rhine confirmed that the mid-facial region is the most accurate for estimating ancestry using a combination of presence/absence and degree of expression charts. When combined, the nasal opening’s shape, the nasion depression, the nasal sill’s development, and the shape of the nasal bones show the most variation between ancestral groups [5]. Currently, the use of non-metric features of the skull is prevalent among anthropologists.
Metric Estimation of Ancestry of Adults
Metric estimation of ancestry relies on the application of craniometrics, where landmarks used for analyses are well established standardized features on the skeleton. These landmarks are generally accepted and commonly referred to throughout the anthropological community. Single measurements or a suite of collected measurements are statistically analyzed to draw conclusions on ancestral group affinity. For example, the linear measurement for the width of the nasal opening and its relationship with decedents of known race allows an estimation of the likelihood of belonging to an ancestral group. Discriminant function analysis is a commonly used statistical tool used to calculate/estimate ancestry based on a suite of measurements. The measurements are inserted within a discriminant function equation based on measurements of decedents of known race to assess how closely related the decedent of unknown race is to each ancestral group or reference sample(s). FORDISC was developed in 1990 and is a statistical program designed to perform discriminant function analysis based on craniometric measurements compared to reference samples stored within the program. One of the reference samples includes a growing Forensic Anthropology Data Bank of donated skeletal material [6].
Limitations of Estimating Ancestry Summary
A drawback to the usage of FORDISC is that analysis is limited to the samples included in the program. The sample sizes within the program are small and some groups lack any female representation. According to Obertova et al. (2020), the Forensic Data Bank (FDB) is composed of 4,000 cases [7]. The cranial measurements derive from a combination of skulls from the Terry and William Bass skeletal collections. The authors did not illustrate a demographic breakdown but reported that the samples are dominated by White and Black individuals. A separate resource reported that males make up 64% of the William Bass collection while only 36% are females. An alarming 93% of the collection is Caucasian, 4% Black, 2% Hispanic, 1% Asian/American Indian [8]. The Terry Collection includes only Black and White males and females. Classification into an ancestral group will be estimated even if the remains do not actually belong to any of these groups. Thus, FORDISC results should be used in combination with other lines of evidence supporting ancestral affinity. As with the estimation of age, sex, and stature, methods developed to estimate ancestry are dependent on the availability of representative reference samples. There is currently no representation of subadults samples within the FORDISC program. According to the Scientific Working Group for Forensic Anthropology (SWGANTH) when using craniometric data, best practice demands that investigators use methods based on sufficient sample sizes and are time period and sex specific [9]. Best practice also demands when estimating ancestry in FORDISC, comparison with all appropriate and available reference groups be made; however, SWGANTH warns the investigator that appropriate reference samples may be unavailable for analysis [9]. The recommendations of SWAGANTH highlight the need to expand the existing collections currently available as the deficiency threatens the entire field of anthropology.
Skeletal Collections
Given that documented skeletal collections are the foundation of anthropological research, training, and education, this section will discuss the threats to the facilitation of anthropological erudition due to the inadequacy of skeletal collections. The age and biased demographic distribution of the collections renders any research-based techniques vulnerable to inaccuracies due to secular change and poor performance on minority groups.Secular change is described by Albanese (2010) as non-genetic changes that occur in the body over generations [10]. The changes are attributed to environmental or extrinsic influences such as diet, habitual activities, and factors associated to socioeconomic status. Changes in cranial morphology and stature have been documented in the anthropological literature and attributed to poor performance of estimation techniques [11-13]. R. L. Jantz and Jantz (2000) compared cranial measurements collected from specimens within the Hamman-Todd collection from the mid-19th century to modern cases within the 20th century Forensic Data Bank and identified significant changes in the dimensions of the cranium in as little as two generations [12].
Diversity Challenges with Skeletal Collections
The collections discussed above are the cornerstone of anthropological research. However, they are dominated by Caucasian males with little to no ancestral or sexually dimorphic diversity. The identification of unknown skeletal remains hinges on accurate and precise methodologies. While anthropological practice aims to create and implement holistic methodologies, there is an apparent disparity in the research rendering the minority populations victims of underrepresentation. A review of the demographic breakdown of crimes requiring identification practices such as cases involving missing persons, unidentified decedents, and victims of violent crimes, revealed that minorities are more vulnerable to such crimes. Statistics showed that as of 2021, while Black men and women make up only 13% of the population in the United States, they represent approximately 25% of the missing person cases and greater than 50% of homicide cases [14-16]. Hispanics make up approximately 18% of the U.S. population and Asians, make up less than 2%. Hispanics are not even represented in the NCIC database. A search of cases in the National Missing and Unidentified Persons Database revealed 2,268 cases of unidentified Black decedents, 3,871 Hispanics, and 370 Asians [17]. These statistics do not represent a complete estimate of all unidentified cases in the U.S. as many more cases are not uploaded to the database or their race could not be estimated for various reasons.
Some researchers have investigated the reason minorities are less likely to participate in body or organ donation. Those sources point to mistrust in the scientific community among the minority populace due to a history of unethical medical treatment [7,16]. Other sources have cited religious beliefs related to postmortem rituals as deterrents to body donation as some rituals require the entire body to be interred in order to enter the afterlife [16,18,19]. In addition, African Americans may not feel that body donation would be of any value to the Black community. Research completed by McNamara et al. (1999) found that Blacks and Hispanics were concerned with disfigurement following body donation as well as the lack of medical professionals to prioritize saving their life over procurement of organs and tissue [20]. Given the concerns provided by the minority groups included in the above studies, it is reasonable to conclude that minorities might be more willing to donate full-body computed tomography scans for scientific research as body scans are non-invasive, can be performed during life, and do not violate any religious mortuary practices.
Living virtual collections would address the aforementioned challenges of antiquated, biased skeletal collections. As demonstrated in this section, minority groups are not represented in the skeletal collections where identification techniques are developed, taught, and refined. The national crime statistics reveal that minorities are more vulnerable to crimes that render them unidentified posing a challenge to forensic practitioners who are responsible for restoring their identities. The time required to expand skeletal collections does not meet the current fast paced demand of the scientific community. Virtual skeletons can be available in minutes and can include a diverse sample of contemporary ancestral groups that are representative of U.S. citizens of both sexes and all ages.
Some of the major drawbacks of creating living virtual skeletal collections included the need to standardize the methodologies and programs used for anthropological analysis, the need for specialized expensive equipment and training, and the vulnerability to subjectivity in interpretation of the landmarks and measurements. However, with the steady forward movement of such studies, forensic anthropology will be able to standardize such methods following proof that the methods and techniques are transferable from dry bone to three-dimensional space or that newer techniques can be developed that are adapted to the new tools of the trade.
This study aims to examine the utility of CT scans to estimation of ancestry and sex and contribute to the greater body of knowledge on this subject. The introduction of CT to the field of anthropology offers an alternative to maceration through virtual access to the skeletal material for examination and the opportunity to access skeletal material of the living or recently deceased and of all ancestral and age groups. The current standard use of maceration, albeit useful, does present significant challenges including the need for additional postmortem damage to the decomposed remains and the overall significant length of time and burden of effort on the part of the forensic anthropologist. There are concerns surrounding the permanent destruction of human tissue during maceration that may hold forensic clues and evidence vital to the case. Additionally, this study will take anthropology a step closer to standardizing methodologies and to follow up on recommendations and concerns documented by previous authors.
Research Aims
While the usage of three-dimensional replicas of skeletal material have increased across the field of forensics, there are currently limited studies demonstrating the utility of computed images for data acquisition for the purposes of estimating race by forensic anthropologists in the medicolegal field. This study aims to investigate and critically evaluate the utility of CT scans for forensic anthropologists and establish a workflow for the application of this modality for the estimation of ancestry in forensic anthropology. To achieve the aims, the following objectives will be addressed within this study:
Critical evaluation of the quality of the CT scan for retention of macroscopic features required for ancestral acquisition.
Determine if there is a difference in classification accuracy between using metric versus non-metric features to determine sex and ancestry using CT scans.
Establish an error rate of ancestral classification of skull replicas produced from CT scans of decedents of known race using the selected method developed in this study.
Determine the practicality of the utility of this proposed technique for determining ancestry and sex in the forensic anthropology context.
To determine the answer, the following research questions will be addressed within this study:
Can CT scans retain the macro and microscopic characteristics used to collect craniometric data?
Can the CT scan of a skull of an individual of known sex and race be correctly classified within the correct ancestral group in the forensic (FORDISC) database?
Is there a statistically significant difference between estimation of ancestry and sex based on craniometric and non-metric data collected from a CT and the decedent’s actual ancestry and sex?
Materials & Methods
This study focused on computed tomography (CT) scans of 86 individuals from the New Mexico Decedent Image Database (NMDID) [21]. According to the NMDID (2023), CT slice thickness was recorded to be 1 mm with 0.5 mm overlap [21]. The managers of the CT collection also document detailed metadata, including the circumstances of death, demographics, and medical history for research purposes. Demographic information was reported by the decedent’s legal next of kin. To obtain access to the collection for this study, a detailed research proposal was composed and submitted to the database manager detailing the nature and purpose of this research. A stratified sample of Black, White, Hispanic and Asian CTs were requested that captured the skull. Head CTs that were subjected to traumatic injury were asked to be excluded. The research proposal was reviewed and approved by managers of the NMDID collection. Approximately 95 CTs were received in Digital Imaging and Communications in Medicine (DICOM) format; however, thermal injuries, metastatic disease, or obstructions on the images narrowed down the pool of applicable images. In total, 83 individuals were carefully selected.
Three-Dimensional Model Preparation
The DICOM data was imported into 3D Slicer (Fedorov et al., 2012), an open-source software program for viewing, editing, and measurement collection [22]. Each set of CTs were imported individually and observed in the 3D Slicer window. The next step involved volume rendering of the scans. The volume of the computed images represents the full stack of “slices” or images physically captured by the CT machine for each individual. The rendering transforms the slices from two dimensions into a three-dimensional model. The volumes of the images were cropped down as closely as possible to capture the head and jaw using the crop module in 3D Slicer. Clothing, jewelry and medical intervention equipment were removed from the images. The soft tissue was virtually macerated providing visualization of the skull and mandible. Segmentation of the volume establishes and defines the area of interest of the model. This action was completed using the segmentation module in 3D slicer. Segmentation was completed using a threshold value of 200.00 as was appropriate to retain external characteristics of the skull. A three-dimensional model was produced from the slices of the CT to prepare for landmark placement and collection of linear measurements. The cervical vertebrae were removed from the images using the scissors tool to provide an unobstructed view of the base of the skull and foramen magnum. This process is demonstrated in Figure 1. The models were assigned a case number and saved in a folder in STL (stereolithography) format as is appropriate for 3D data. During this process, an additional case was excluded from the study as thermal trauma rendered the skull fragmented, which prevented measurements from being taken. The level of reconstruction that skull would require was beyond the scope of this study. The distribution of sex and race for the CTs used for downstream analysis are outlined in Table 1.
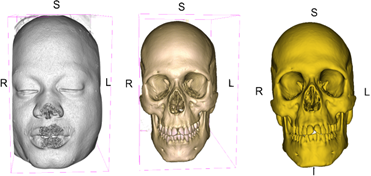
Figure 1: Three-Dimensional Model Created in 3D Slicer
Table 1: Distribution of Race and Sex in the Study Sample
| Sex | Black | White | Hispanic | Native American | Asian |
| Male | 10 | 12 | 20 | 1 | 0 |
| Female | 12 | 13 | 14 | 0 | 1 |
| Total | 23 | 25 | 34 | 1 | 1 |
Note. N = 83.
Linear-Measurement Collection
During the data acquisition process, the 3D models were opened in 3D Slicer’s scene window. Each plane was observed and rotated in sagittal, coronal and axial views in the program. Seventeen craniometric landmarks were selected for this study secondary to their effectiveness of estimating ancestry and sex. The seventeen landmarks are defined in Table 2. The landmarks were placed on the models in their respective positions using the markups tool in 3D Slicer. The landmarks were represented by small spheres that could be manipulated until optimal placement was achieved in accordance with traditional methodologies. The positions of each landmark were automatically recorded as coordinates in three-dimensional space and point to point linear measurements were collected. All measurements were documented in millimeters (mm) as per traditional anthropological protocol. Twenty-two linear measurements were collected from the virtual models and recorded on a data collection form. The measurements are detailed in Table 3. The models with their coordinates were saved in the case file.
Table 2: Landmarks Defined
| Landmark | Definition |
| Alare (al) | Most lateral point of the nasal aperture in a transverse plane |
| Auriculare (au) | Point of the deepest inward curvature on the lateral aspect of the of the zygomatic process |
| Basion (ba) | Midline point of the anterior foramen magnum in midsagittal plane |
| Bregma (b) | Point of intersection between the coronal and sagittal sutures |
| Dacryon (d) | Point of medial borer of the orbit that marks the junction of the sutures between the frontal, maxillary and lachrymal bones |
| Ectoconchion (ec) | Intersection of the most anterior surface of the lateral border of the orbit and a line bisecting the orbit along its superior margin |
| Euryon (eu) | Bilateral points on either skull that demonstrate the greatest cranial breadth |
| Frontotemporale (ft) | Most anteromedial point of the of the forehead |
| Frontomalare temporale (fmt) | Most laterally positioned point of the fronto-malar |
| Glabella (g) | Point of most forward projection of the forehead (at the midline level of the supraorbital ridges) |
| Lambda (l) | Midpoint where the sagittal and lambdoidal sutures intersect |
| Nasion (n) | Point of junction of the internasal and nasofrontal sutures in midsagittal plane |
| Nasospinale (ns) | Inferiormost point of the nasal aperture in midsagittal plane |
| Opisthion (o) | Midpoint of the posterior margin of the foramen magnum in mid sagittal plane |
| Opisthocranion (op) | Most posterior point of the skull excluding the occipital protuberance |
| Prosthion (pr) | Most anterior point of the alveolar process of the maxilla |
| Zygion (zy) | Most lateral point of the zygomatic arch |
Note. Data adapted from Standards for Data Collection from Human Skeletal Remains: Proceedings of a Seminar at the Field Museum of Natural History (Report No. 44 p. 71-77), edited by J. E. Buikstra and D. H. Ubelaker, 1994, Arkansas Archeological Survey.
Table 3: Measurements Defined
| Measurement | Landmarks | Description |
| Max cranial length (GOL) | (g) to (op) | Distance between glabella to opisthocranion in the mid-sagittal plane |
| Maximum cranial breadth (XCB) | (eu) to (eu) | Max width of the skull perpendicular to the mid sagittal plane |
| Bizygomatic breadth (ZYB) | (zy) to (zy) | Distance between the most lateral points of the zygomatic arches |
| Basion–bregma height (BBH) | (ba) to (b) | Distance between the anterior margin of the foramen magnum to bregma |
| Cranial base length (BNL) | (n) to (ba) | Distance between nasion to basion |
| Basion prosthion length (BPL) | (ba) to (pr) | Distance from basion to prosthion |
| Biauricular breadth (AUB) | (au) to (au) | Least exterior breadth across the roots of the zygomatic processes from left to right |
| Upper facial height (UPFT) | (n) to (pr) | Distance from nasion to prosthion |
| Minimum frontal breadth (WFB) | (ft) to (ft) | Direct distance between left and right frontotemporale |
| Upper facial breadth (UFBR) | (fmt) to (fmt) | Direct distance between left and right frontomalare temporale |
| Nasal height (NLH) | (n) to (ns) | Distance from nasion to nasospinale |
| Nasal breadth (NLB) | (al) to (al) | Maximum breadth of the nasal aperture |
| Orbital breadth (OBB) | (d) to (ec) | Laterally sloping distance from dacryon to ectoconchion |
| Orbital height (OBH) | Distance between the superior and inferior orbital margins | |
| Biorbital breadth (EKB) | (ec) to (ec) | Direct distance from between left and right ectoconchion |
| Interorbital breadth (DKB) | (d) to (d) | Direct distance between left and right dacryon |
| Frontal chord (FRC) | (n) to (b) | Direct distance from nasion to bregma in the midsagittal plane |
| Parietal chord (PAC) | (b) to (l) | Direct distance from bregma to lambda in midsagittal plane |
| Occipital chord (OCC) | (l) to (o) | Direct distance from lambda to opisthion in midsagittal plane |
| Foramen magnum length (FOL) | (ba) to (o) | Direct distance of basion to opisthion |
| Foramen magnum breadth (FOB) | Distance between the lateral margins of the foramen magnum | |
| Zygomaxilare anterior (ZYM) | Point where the zygomatic bone meets the maxilla |
Note. (g) = glabella; (op) = opisthocranion; (eu) = euryon; (zy) = zygion; (ba) = basion; (b) = bregma; (n) = nasion; (pr) = prosthion; (au) = auriculare; (ft) = frontotemporale; (fmt) = frontomalare temporale; (ns) = nasospinale; (al) = alare; (d) = dacryon; (ec) = ectoconchion; (l) = lambda; (o) = opisthion. Adapted from DATA COLLECTION PROCEDURES FOR FORENSIC SKELETAL MATERIAL 2.0 by Langley, N., Meadows Jantz, L., Ousley, S., Jantz, R., & Milner, G., 2016. In Mayoclinic.
https://www.academia.edu/25652496/DATA_COLLECTION_PROCEDURES_FOR_FORENSIC_SKELETAL_MATERIAL_2_0. Adapted with permission.
Non-Metric Data Collection
In addition to craniometric data collection, five non-metric traits commonly employed to estimate sex were observed in three-dimensional space in accordance with Buikstra and Ubelaker (1994) [23]. The supra orbital ridge, the mastoid process, mental eminence, nuchal crest and supra-orbital margin were evaluated for its manifestation on the models and the ability to be visualized on the three-dimensional replicas as viewed in Figure 2. The ordinal scores of one through five were assigned individually to each trait independent of the other traits.

Figure 2: Non-Metric Trait Scores for Estimating Sex on a 3D Model
Results
The results of classification accuracy of sex and ancestry are detailed in Tables 4 and 5. Table 4 reflects the accuracy of ancestry and sex when sex is unknown. White and Black females had the highest accuracy for classification at 92% and 83% respectively when comparing all ancestral groups with both sexes within the FORDISC database. However, Hispanic males outperformed their female counterparts with a classification accuracy of 45% when sex was unknown. One Black male was classified as a Black female, a White male, and a Hispanic male. Black females were not misclassified within a different race; however, two were falsely classified as Black males. Two white males were misclassified as White females and one as a Hispanic male. Greater than 50% of Hispanic males were misclassified; two as Black males, five as White males, two as Japanese males and two as Native American Males. Hispanic females were misclassified most frequently. Two Hispanic females classified as Black females, two as White males, one as a White female, two as Native American females and one as a Japanese female. The one Japanese female in the study sample was correctly classified as a Japanese female. However, the one Native American male was falsely classified as a Black male.
Table 4: Cross Validation Classification Accuracy of Sex and Ancestry in FORDISC When Sex Is Unknown
| Category | n | Black | White | Hispanic | Japanese | Native American | % correct ancestry | |||||
| M | F | M | F | M | F | M | F | M | F | |||
| Black | ||||||||||||
| M | 10 | 7 | 1 | 1 | 0 | 1 | 0 | 0 | 0 | 0 | 0 | 70 |
| F | 12 | 2 | 10 | 0 | 0 | 0 | 0 | 0 | 0 | 0 | 0 | 83 |
| White | ||||||||||||
| M | 12 | 0 | 0 | 9 | 2 | 1 | 0 | 0 | 0 | 0 | 0 | 75 |
| F | 13 | 0 | 0 | 0 | 12 | 1 | 0 | 0 | 0 | 0 | 0 | 92 |
| Hispanic | ||||||||||||
| M | 20 | 2 | 0 | 5 | 0 | 9 | 0 | 2 | 0 | 2 | 0 | 45 |
| F | 14 | 0 | 2 | 2 | 1 | 0 | 6 | 0 | 1 | 0 | 2 | 42 |
| Japanese | ||||||||||||
| F | 1 | 0 | 0 | 0 | 0 | 0 | 0 | 0 | 1 | 0 | 0 | 100 |
| Native American | ||||||||||||
| M | 1 | 1 | 0 | 0 | 0 | 0 | 0 | 0 | 0 | 0 | 0 | 0 |
Note. N = 83. M = male; F = female.
Table 5: Cross Validation Classification Accuracy of Ancestry in FORDISC When Sex Is Known
| Category | n | Black | White | Hispanic | Japanese | Native American | % correct ancestry | |||||
| M | F | M | F | M | F | M | F | M | F | |||
| Black | ||||||||||||
| M | 10 | 9 | 0 | 0 | 0 | 1 | 0 | 0 | 0 | 0 | 0 | 90 |
| F | 12 | 0 | 12 | 0 | 0 | 0 | 0 | 0 | 0 | 0 | 0 | 100 |
| White | ||||||||||||
| M | 12 | 0 | 0 | 12 | 0 | 0 | 0 | 0 | 0 | 0 | 0 | 100 |
| F | 13 | 0 | 0 | 0 | 13 | 0 | 0 | 0 | 0 | 0 | 0 | 100 |
| Hispanic | ||||||||||||
| M | 20 | 1 | 0 | 3 | 0 | 11 | 0 | 0 | 0 | 5 | 0 | 55 |
| F | 14 | 0 | 2 | 0 | 3 | 0 | 6 | 0 | 1 | 0 | 2 | 42 |
| Japanese | ||||||||||||
| F | 1 | 0 | 0 | 0 | 0 | 0 | 0 | 0 | 1 | 0 | 0 | 100 |
| Native American | ||||||||||||
| M | 1 | 1 | 0 | 0 | 0 | 0 | 0 | 0 | 0 | 0 | 0 | 0 |
Note. N = 83. M = male; F = female.
Table 5 reflects the accuracy of ancestry classification when sex is known. Classification within the correct ancestral group improved significantly for most groups. Hispanic females, however, saw no increase in classification power even when males were eliminated from the comparison pool. While improvement was seen with Hispanic males, classification accuracy remained low at 55%. Black females, White males, and White females were correctly classified within the correct ancestral group in 100% of cases with Black males closely behind at 90%. The Native American male remained misclassified as a Black male. Tables 6 and 7 reflect classification accuracy of ancestry when sex is known and unknown when both sexes are pooled together.
Table 6: Classification Accuracy of Ancestry Estimation When Sex Is Pooled and Sex Is Unknown
| Ancestry a | True race | |||||||||
| Black | Hispanic | Japanese | Native American | White | ||||||
| n | % | n | % | n | % | n | % | n | % | |
| Black | 20 | 90.9 | 4 | 11.8 | 0 | 0.0 | 1 | 100.0 | 0 | 0.0 |
| Hispanic | 1 | 4.5 | 19 | 55.9 | 0 | 0.0 | 0 | 0.0 | 2 | 8.0 |
| Japanese | 0 | 0.0 | 2 | 5.9 | 1 | 100.0 | 0 | 0.0 | 0 | 0.0 |
| Native American | 0 | 0.0 | 1 | 2.9 | 0 | 0.0 | 0 | 0.0 | 0 | 0.0 |
| White | 1 | 4.5 | 8 | 23.5 | 0 | 0.0 | 0 | 0.0 | 23 | 92.0 |
| Total | 22 | 100.0 | 34 | 100.0 | 1 | 100.0 | 1 | 100.0 | 25 | 100.0 |
a Metric estimation of ancestry when sex is unknown.
Table 7: Classification Accuracy of Ancestry Estimation When Sex Is Pooled and Sex Is Known
| Ancestry a | True race | |||||||||
| Black | Hispanic | Japanese | Native American | White | ||||||
| n | % | n | % | n | % | n | % | n | % | |
| Black | 21 | 95.5 | 3 | 8.8 | 0 | 0.0 | 1 | 100.0 | 0 | 0.0 |
| Hispanic | 1 | 4.5 | 19 | 55.9 | 0 | 0.0 | 0 | 0.0 | 0 | 0.0 |
| Japanese | 0 | 0.0 | 1 | 2.9 | 1 | 100.0 | 0 | 0.0 | 0 | 0.0 |
| Native American | 0 | 0.0 | 5 | 14.7 | 0 | 0.0 | 0 | 0.0 | 0 | 0.0 |
| White | 0 | 0.0 | 6 | 17.6 | 0 | 0.0 | 0 | 0.0 | 25 | 100.0 |
| Total | 22 | 100.0 | 34 | 100.0 | 1 | 100.0 | 1 | 100.0 | 25 | 100.0 |
a Metric estimation of ancestry when sex is known.
According to the one sample T-tests, as can be seen in Table 8, group means at the following measurements were statistically significant between Black males in the study sample and the Black males in the FORDISC databank: interorbital breadth (DKB) (-1.70), biorbital breadth (EKB) (-4.60mm), foramen magnum length (FOL) (-1.90mm), orbital height (OBH) (-1.40mm), and upper facial height (UFHT) (-3.60mm). The mean difference is listed in parenthesis. At all significant locations, the study sample’s measurements were consistently smaller than those in FORDISC. When comparing the group means between White males, statistically significant differences were noted at the following locations: interorbital breadth (DKB) (-1.40mm), biorbital breadth (EKB) (-3.41mm), foramen magnum breadth (FOB) (-2.41mm), orbital breadth (OBB) (-1.03mm), and parietal chord (PAC) (1.033mm). Excluding parietal chord, all significant measurements were again smaller among the study sample.
Table 8: Comparison of Means for Males Between the Study and FORDISC Samples
| Measurement | Black | White | Hispanic | ||||||
| SS | FD | p | SS | FD | p | SS | FD | p | |
| Biauricular breadth | 120.3 | 121.0 | .553 | 124.7 | 123.3 | .169 | 125.6 | 124.0 | .104 |
| Basion–bregma height | 138.9 | 137.0 | .430 | 142.9 | 140.3 | .220 | 142.4 | 135.8 | .000 |
| Cranial base length | 105.0 | 103.9 | .358 | 107.0 | 105.0 | .111 | 105.2 | 100.4 | .000 |
| Basion prosthion length | 105.2 | 103.5 | .272 | 97.7 | 97.2 | .576 | 99.1 | 98.0 | .461 |
| Interorbital breadth | 21.9 | 23.6 | .015 | 20.0 | 21.4 | .044 | 19.7 | 20.9 | .000 |
| Biorbital breadth | 95.9 | 100.5 | .000 | 94.75 | 98.0 | .002 | 96.1 | 96.3 | .794 |
| Foramen magnum breadth | 29.3 | 30.2 | .154 | 29.5 | 32.0 | .011 | 30.4 | 30.8 | .379 |
| Foramen magnum length | 35.0 | 36.9 | .006 | 37.0 | 37.6 | .501 | 37.1 | 36.5 | .217 |
| Frontal chord | 114.4 | 112.7 | .195 | 117.4 | 114.7 | .122 | 118.1 | 110.7 | .021 |
| Max cranial length | 189.2 | 186.7 | .079 | 190.0 | 187.3 | .149 | 186.8 | 177.8 | .000 |
| Mastoid height | 34.3 | 33.4 | .441 | 32.1 | 32.2 | .957 | 31.9 | 29.6 | .000 |
| Nasal height | 51.2 | 52.8 | .170 | 51.8 | 52.7 | .271 | 53.8 | 52.2 | .013 |
| Nasal breadth | 25.7 | 26.5 | .172 | 23.8 | 24.2 | .546 | 24.5 | 25.0 | .243 |
| Orbital breadth | 40.5 | 41.1 | .280 | 40.1 | 41.2 | .022 | 40.5 | 39.7 | .029 |
| Orbital height | 34.0 | 35.4 | .012 | 33.5 | 34.2 | .184 | 34.9 | 35.4 | .129 |
| Occipital chord | 100.6 | 99.3 | .411 | 100.3 | 100.4 | .961 | 102.0 | 96.6 | .006 |
| Parietal chord | 120.1 | 117.0 | .110 | 122.3 | 117.8 | .019 | 120.8 | 111.6 | .000 |
| Upper facial breadth | 105.8 | 106.9 | .278 | 103.8 | 104.8 | .285 | 106.9 | 103.3 | .001 |
| Upper facial height | 69.1 | 72.7 | .039 | 69.6 | 72.0 | .086 | 71.8 | 73.5 | .152 |
| Minimum frontal breadth | 95.3 | 95.9 | .627 | 96.7 | 96.8 | .553 | 98.5 | 93.7 | .000 |
| Maximum cranial breadth | 135.1 | 135.7 | .736 | 139.0 | 140.4 | .293 | 141.0 | 138.2 | .033 |
| Zygomaxilare anterior | 93.0 | 92.9 | .958 | 99.7 | 89.4 | .595 | 93.0 | 93.7 | .545 |
| Bizygomatic breadth | 129.0 | 130.6 | .266 | 131.1 | 129.7 | .251 | 134.2 | 130.9 | .007 |
Note. Values in millimeters. Comparisons were made with one-sample, two-tailed t tests.
Hispanic males showed the greatest disparity between the study sample and FORDISC’s sample. Measurements proven to be larger and statistically significant consisted of basion bregma height (BBH) (6.65mm), basion nasal length (BNL) (4.90mm), frontal chord (FRC) (7.40mm), maximum cranial length (GOL) (9.05mm), mastoid height (MDH) (2.30mm), nasal height (NHL) (1.65mm), orbital breadth (OBB) (.85mm), occipital chord (OCC) (5.45mm), parietal chord (PAC) (9.20mm), upper facial breadth (UFBR) (3.60mm), minimal facial breadth (WFB) (4.85), maximum cranial breadth (XCB) (2.80mm), and bizygomatic breadth (ZYB) (3.30mm). Interorbital breadth (DKB) (-1.150mm) was also significant although smaller in the study sample.
As reflected in Table 9, the results of the one sample t-tests revealed that group means between Black females in the study sample and FORDISC were statistically significant at mastoid height (MDH) (2.60mm) and upper facial height (UFBR) (2.95mm) with the study sample measuring larger. White females in the study sample were found to be significantly smaller at foramen magnum length (FOL) (-1.88mm) and larger at frontal chord (FRC) (3.80mm). Like Hispanic males, Hispanic females exhibited the greatest disparity between the study sample and FORDISC’s sample. Hispanic females were larger at basion nasion length (BNL) (4.04mm), basion prosthion length (BPL) (1.97mm), frontal chord (FRC) (3.90mm), maximum cranial length (GOL) (7.15mm), mastoid height (MDH) (3.32mm), occipital chord (OCC) (4.60mm), parietal chord (PAC) (3.91mm), upper facial breadth (UFBR) (2.50mm), and minimum facial breadth (WFB) (2.21mm). Hispanic females were significantly smaller at interorbital breadth (DKB) (-1.07mm), foramen magnum breadth (FOB) (-1.22mm), orbital height (OBH) (-2.00mm), and zygomaxilare anterior (ZMB) (-2.98mm).
Table 9: Comparison of Means for Females Between the Study and FORDISC Samples
| Measurement | Black | White | Hispanic | ||||||
| SS | FD | p | SS | FD | p | SS | FD | p | |
| Biauricular breadth | 116.1 | 114.9 | .241 | 117.0 | 117.1 | .937 | 117.1 | 118.8 | .136 |
| Basion–bregma height | 132.4 | 131.1 | .304 | 135.1 | 134.3 | .580 | 132.9 | 130.1 | .068 |
| Cranial base length | 98.6 | 98.7 | .981 | 98.0 | 98.9 | .246 | 99.1 | 95.1 | .003 |
| Basion prosthion length | 99.6 | 99.5 | .936 | 91.0 | 91.8 | .641 | 94.5 | 92.6 | .034 |
| Interorbital breadth | 21.1 | 22.0 | .075 | 19.5 | 20.0 | .307 | 18.9 | 20.0 | .002 |
| Biorbital breadth | 95.7 | 95.4 | .729 | 92.6 | 93.6 | .270 | 92.4 | 93.7 | .054 |
| Foramen magnum breadth | 27.5 | 28.6 | .162 | 29.2 | 30.4 | .142 | 28.5 | 29.8 | .020 |
| Foramen magnum length | 34.9 | 35.1 | .827 | 35.6 | 37.5 | .044 | 34.7 | 35.4 | .156 |
| Frontal chord | 116.1 | 108.5 | .255 | 113.0 | 109.2 | .007 | 109.0 | 105.1 | .003 |
| Max cranial length | 181.5 | 178.8 | .302 | 177.7 | 177.2 | .777 | 176.3 | 169.2 | .000 |
| Mastoid height | 30.5 | 27.9 | .000 | 28.6 | 27.6 | .195 | 28.9 | 25.6 | .000 |
| Nasal height | 48.3 | 48.6 | .675 | 49.2 | 48.6 | .506 | 48.7 | 49.0 | .693 |
| Nasal breadth | 25.4 | 25.1 | .572 | 22.9 | 22.6 | .435 | 23.9 | 24.1 | .746 |
| Orbital breadth | 39.9 | 38.8 | .053 | 38.4 | 39.3 | .059 | 38.6 | 38.9 | .484 |
| Orbital height | 35.0 | 34.7 | .495 | 33.4 | 33.3 | .794 | 33.5 | 35.5 | .000 |
| Occipital chord | 100.0 | 97.7 | .128 | 96.6 | 97.3 | .658 | 99.5 | 94.9 | .002 |
| Parietal chord | 117.0 | 113.0 | .137 | 117.0 | 113.0 | .054 | 111.7 | 107.8 | .018 |
| Upper facial breadth | 104.2 | 101.3 | .000 | 100.6 | 100.0 | .696 | 101.5 | 99.0 | .030 |
| Upper facial height | 67.9 | 67.3 | .292 | 65.3 | 66.5 | .464 | 66.3 | 67.0 | .323 |
| Minimum frontal breadth | 94.3 | 93.7 | .528 | 93.5 | 93.9 | .728 | 92.7 | 90.5 | .013 |
| Maximum cranial breadth | 133.3 | 133.2 | .937 | 135.2 | 135.8 | .720 | 133.9 | 133.4 | .327 |
| Zygomaxilare anterior | 89.1 | 87.7 | .294 | 86.2 | 85.1 | .226 | 86.7 | 89.7 | .014 |
| Bizygomatic breadth | 125.0 | 122.3 | .038 | 122.2 | 120.7 | .338 | 123.1 | 122.7 | .443 |
Note. Values in millimeters. Comparisons were made with one-sample, two-tailed t tests.
Table 10: Classification Accuracy of Ancestry Using Non-Metric Traits on Three-Dimensional Models
| Ancestry | n | Black | White | Hispanic | Percentage Accuracy |
| Black | 22 | 22 | 0 | 0 | 100 |
| White | 25 | 0 | 21 | 4 | 84 |
| Hispanic | 34 | 1 | 6 | 27 | 79 |
| Total | 81 |
Discussion
The primary purpose of this study was to determine if techniques to estimate sex and ancestry applied to dry skeletal remains could be replicated using virtual three-dimensional (3D) models developed from postmortem computed tomography scans. Analysis of previous literature suggests that three dimensional replicas of human skulls from CTs have been created successfully for the purpose of learning anatomy, visual aids in the courtroom, and for forensic investigations in various capacities [24,25]. While the usage of three-dimensional replicas of skeletal material have increased across the field of forensics, there is currently minimal literature demonstrating the utility of skull replicas for data acquisition for the purposes of estimating ancestry by forensic anthropologists. The most common underlying issues with estimating ancestry using available skeletal reference samples and databases are the underrepresentation of both contemporary and ancestrally diverse groups and the complete non-representation of subadults in current studies.
By addressing the aims presented in the study, the primary research questions were answered:
Can CT scans retain the macro and microscopic characteristics used to collect craniometric data? Yes, the necessary detail required to estimate sex and race was present at the metric and non-metric level.
Can the CT scan of a skull of an individual of known sex and race be correctly classified within the correct ancestral group in the forensic (FORDISC) database? Blacks and Whites in the study sample were successfully classified within the correct sex and ancestral group with an acceptable margin of error. Hispanics, however, did not attain the same level of success with rates lower than or equal to chance. The contributing factors to the significant error was discussed at length and centered on the possibility of self-identification throughout the Hispanic population and the troubling social grouping of Hispanics as an arbitrary racial “group “rather than biologically and culturally distinct peoples.
Is there a statistically significant difference between craniometric data collected from virtual 3D models and dry skulls? While there were statistically significant differences for some linear measurements for Blacks and Whites, classification accuracy was not significantly impacted for Blacks and Whites.
In this study, ancestry was estimated both when sex was known and when sex was unknown to determine how well this methodology performs in either scenario. As was illustrated in Table 4, when sex was unknown, White females were most accurately classified into the correct sex and ancestry. One White female classified as a Hispanic male. One Black male was classified as a Black female. Two Black females were classified as Black males. Neither Black males nor females were misclassified into the incorrect race. Two White males were misclassified as White females. The single Japanese female was correctly classified within the right sex and ancestry. The single Native American classified as a Black male. However, there were not enough Asians and Native Americans in the sample to make any generalizations.
When sex was known and the comparison sample was limited to the correct sex and only ancestry was estimated, classification accuracy improved into the ninety percentile and greater for Whites and Blacks as demonstrated in Table 5. Similar success was not attained for Hispanic males and females. Hispanic males improved by 10% with 55 percentage accuracy and Hispanic females saw no improvement with only 42 percentage accuracy. Tables 6 and 7 reflect accuracy of ancestry when sex is pooled. For the purposes of this study, the term Hispanic is used to describe individuals who derive from Mexico, Puerto Rico, Cuba, South and Central America without regard for their diverse cultural and genetic backgrounds [26].
As highlighted in a study by Ross et al. (2004), morphological differences between Cubans are notable in the cranial region [27]. Utilizing geometric morphometrics, Ross and colleagues identified strong similarities between modern Cubans and African American Blacks with some Spanish components. Modern Mexicans, on the other hand, were craniometrically similar to indigenous American Indian groups. Ross et al. attributed these differences to settlement patterns among Hispanics and the Spanish conquest. Cubans reportedly make up the largest Hispanic group in the state of Florida [27]. The diversity among the groups significantly impacts the way forensic anthropologists should study these groups and contribute to the identification process. Dudzik and Jantz (2016) found that Hispanics from the American Southwest were commonly classified as Asian in FORDISC 3.1 at a concerning rate [28]. While it was expected for Hispanics from the Southwest region to misclassify as White or Native American as is consistent with settlement patterns; it was unclear to the authors why Hispanics commonly misclassified as Asian, specifically Japanese when Asians were not known to contribute to the Hispanic gene pool [28]. This is another factor that needs to be explored and addressed accordingly among the contemporary Hispanic groups.
In this study, the majority of the Hispanic males misclassified as Native American. One Hispanic male misclassified as a Black male and another as a White male. As was the case in Dudzik and Jantz’s (2016) study, one Hispanic female classified as Japanese [28]. Three Hispanic females classified as White and two as Black. Based on previous studies, the misclassifications may be attributed to the diverse population of Hispanics in the New Mexico region, which is where the study sample derives. According to the U.S. Census Bureau (2021), Hispanics made up 47.8 percent of the population in the state of New Mexico many of whom have migrated from Mexico and central America [29]. The results further substantiate the need for Hispanic groups to be further analyzed and separated by ancestral groups with genetic relatedness as opposed to a nonsensical social cluster. The ability to study such living groups with computed tomography studies with the methods utilized in this study could identify craniometric diversity among Hispanics.
It is not assumed that any bias in the results of this study could be attributed to the three-dimensional conditions of which the study was conducted as classification accuracy was in the 70th percentile or greater with the exception of Hispanic males and females. Furthermore, classification accuracy of ancestry significantly improved when sex was previously estimated. The results of this study were on par with traditional dry skull results who estimated ancestry using FORDISC in various agencies conducting forensic casework with up to 95 percentage accuracy [30].
There are many implications for future researchers to build upon from this study. There were challenges correctly classifying Hispanics using craniometric data collected in the virtual workspace. It was unclear if the imprecisions were related to discrepancies in self-identification (Hispanic vs White vs other race) meaning a person who is of Spanish Speaking origin and would be socially classified as Hispanic, but self identifies as White, or inaccuracy of the measurements collected using 3D Slicer. A concentrated, direct comparison of measurements collected from three dimensional models and the post macerated dry skulls of Hispanic males and females should be conducted. A parallel investigation into the sample’s ethnic background should be performed to distinguish where each individual has descended from and note any differences in the skeletal morphology. For a direct continuation of this research, similar studies can be performed with larger sample sizes.
Limitations to the use of using virtual three-dimensional (3D) models developed from postmortem computed tomography scans are the inability to physically palpate the skull and evaluate characteristics that can be better assessed in tangible space such as overall structure of the skull and the sharpness of the orbital margins. This hurdle can be overcome by printing out the 3D model if the anthropologist has access to such hardware. While the skulls in this study focused on CTs free of trauma or anatomical anomalies, this methodology would be difficult to apply to skulls that are fragmented or exhibit significant trauma and may still require maceration and reconstruction.
The results of this study will promote conversation and encourage further research within the forensic anthropology community regarding the possibility of creating three dimensional skeletal collections and the streamlining of techniques and software. This study was grounded on the need for a great expansion of contemporary skeletal collections to propel forensic anthropology forward in the accurate and precise classification and inclusion of all ancestral groups. Many of the challenges associated with creating anthropological methods specific to minority groups center on the lack of population specific skeletal collections. The results of this study demonstrate the viability of virtual anthropological examinations affirming virtual skeletal collections as a practicable, sustainable option in place of dry skeletal samples. Thus, the building of living skeletal collections would greatly expand accessibility of anatomical data for groups who are underrepresented in current skeletal collections for research and reference purposes. Hispanic groups can be separated based on biological traits and skeletal morphology, improving current techniques used to classify ancestral groups.
There are numerous benefits to the development of virtual skeletal collections that address concerns beyond the inclusion of diverse contemporary groups. Members within the virtual collections can provide consent, eliminating any ethical concerns related to studies using human samples. Any skeletal research would be noninvasive, inflicting no damage to skeletal material. There is no need for special tools or equipment and access to the collections would be instantly available from anywhere in the world and could include any groups of people derived from any population and of any age.
The success of this investigation opens the door to represent groups that had not been previously studied, not due to lack of rigor on part of forensic anthropologists, but lack of available resources such as expansive skeletal collections. Implications of this research reach beyond that of ancestral research but provide a tool to forensic anthropologists to permanently clear the hurdle of not having skeletal material for any study of importance. The implications of this study are a benefit to anthropology, law enforcement, and the entire medicolegal community.
References
- Bass, W. M. (2005). Human osteology: A laboratory and field manual. Missouri Archaeological Society.
Publisher | Google Scholor - Christensen, A. M., Passalacqua, N. V., & Bartelink, E. J. (2014). Forensic anthropology: Current methods and practice. Academic Press.
Publisher | Google Scholor - Phenice, T. W. (1969). A newly developed visual method of sexing the os pubis. American Journal of Physical Anthropology, 30(2):297–301.
Publisher | Google Scholor - Spradley, M. K. (2016). Metric methods for the biological profile in forensic anthropology: Sex, ancestry, and stature. Academic Forensic Pathology, 6(3):391–399.
Publisher | Google Scholor - Gill, G. W. (1990). Skeletal attribution of race: Methods for forensic anthropology (Anthropological Paper No. 4). Maxwell Museum of Anthropology.
Publisher | Google Scholor - Manthey, L., Jantz, R. L., Vitale, A., & Cattaneo, C. (2018). Population specific data improves FORDISC®’s performance in Italians. Forensic Science International, 292:263.e1–263.e7.
Publisher | Google Scholor - Obertová, Z., Stewart, A., & Cattaneo, C. (2020). Statistics and probability in forensic anthropology. Academic Press.
Publisher | Google Scholor - Forensic Anthropology Center. (2017, May 22). WM Bass donated skeletal collection.
Publisher | Google Scholor - National Institute of Standards and Technology. (2023). Name of the report.
Publisher | Google Scholor - Albanese, J. (2010). A critical review of the methodology for the study of secular change using skeletal data. Ontario Archaeology Occasional Publications, 2010(9):139–156.
Publisher | Google Scholor - Jantz, L. M., & Jantz, R. L. (1999). Secular change in long bone length and proportion in the United States, 1800–1970. American Journal of Physical Anthropology, 110(1):57–67.
Publisher | Google Scholor - Jantz, R. L., & Jantz, L. M. (2000). Secular change in craniofacial morphology. American Journal of Human Biology, 12(3):327–338.
Publisher | Google Scholor - Jantz, R. L., & Jantz, L. M. (2016). The remarkable change in Euro-American cranial shape and size. Human Biology, 88(1):56.
Publisher | Google Scholor - Federal Bureau of Investigation. (2023). 2022 NCIC missing person and unidentified person statistics.
Publisher | Google Scholor - U.S. Census Bureau. (2022). 2020 census illuminates racial and ethnic composition of the country.
Publisher | Google Scholor - Winburn, A. P., Jennings, A., Steadman, D. W., & DiGangi, E. A. (2020). Ancestral diversity in skeletal collections: Perspectives on African American body donation. Forensic Anthropology, 5(2):141–152.
Publisher | Google Scholor - The National Missing and Unidentified Persons System. (n.d.). NamUs.
Publisher | Google Scholor - Callender, C. O., Hall, L., C, Y., Barber, J. R., Dunston, G. M., & Pinn-Wiggins, V. W. (1991). Organ donation and Blacks. New England Journal of Medicine, 325(6):442–444.
Publisher | Google Scholor - Callender, C. O., & Miles, P. V. (2010). Minority organ donation: The power of an educated community. Journal of the American College of Surgeons, 210(5):708–715.
Publisher | Google Scholor - McNamara, P. J., Guadagnoli, E., Evanisko, M. J., Beasley, C. L., Ea, S., Callender, C. O., & Christiansen, E. H. (1999). Correlates of support for organ donation among three ethnic groups. Clinical Transplantation, 13(1):45–50.
Publisher | Google Scholor - New Mexico Decedent Image Database. (2023). Welcome home.
Publisher | Google Scholor - Fedorov, A., Beichel, R., Kalpathy-Cramer, J., Finet, J., Fillion-Robin, J., Pujol, S., et al. (2012). 3D Slicer as an image computing platform for the Quantitative Imaging Network. Magnetic Resonance Imaging, 30(9):1323–1341.
Publisher | Google Scholor - Buikstra, J. E., & Ubelaker, D. H. (Eds.). (1994). Standards for data collection from human skeletal remains: Proceedings of a seminar at the Field Museum of Natural History (Report No. 44). Arkansas Archeological Survey.
Publisher | Google Scholor - Carew, R. M., Morgan, R. M., & Rando, C. (2018). A preliminary investigation into the accuracy of 3D modeling and 3D printing in forensic anthropology evidence reconstruction. Journal of Forensic Sciences, 64(2):342–352.
Publisher | Google Scholor - Simmons-Ehrhardt, T., Ehrhardt, C. J., & Monson, K. L. (2019). Evaluation of the suitability of cranial measurements obtained from surface-rendered CT scans of living people for estimating sex and ancestry. Journal of Forensic Radiology and Imaging, 19:Article 100338.
Publisher | Google Scholor - Ramirez, E., & De La Cruz, G. (2003). The Hispanic population in the United States: March 2002. U.S. Census Bureau.
Publisher | Google Scholor - Ross, A. H., Slice, D. E., Ubelaker, D. H., & Falsetti, A. B. (2004). Population affinities of 19th century Cuban crania: Implications for identification criteria in South Florida Cuban Americans. Journal of Forensic Sciences, 49(1):1–6.
Publisher | Google Scholor - Dudzik, B., & Jantz, R. L. (2016). Misclassifications of Hispanics using FORDISC 3.1: Comparing cranial morphology in Asian and Hispanic populations. Journal of Forensic Sciences, 61(5):1311–1318.
Publisher | Google Scholor - U.S. Census Bureau. (2021, October 8). 2017 New Mexico state population trends.
Publisher | Google Scholor - Thomas, R. M., Parks, C. L., & Richard, A. H. (2017). Accuracy rates of ancestry estimation by forensic anthropologists using identified forensic cases. Journal of Forensic Sciences, 62(4):971–974.
Publisher | Google Scholor