
Research Article
Synergizing Science and Software in Precision Formulation of Membrane-Adhesive Tablets
IPS Academy College of Pharmacy, Indore, Madhya Pradesh, India.
*Corresponding Author: Akash Yadav, IPS Academy College of Pharmacy, Indore, Madhya Pradesh, India.
Citation: Khadsondni K., Mandloi K., Sonare T., Kumar A., Yadav A., et al. (2025). Synergizing Science and Software in Precision Formulation of Membrane-Adhesive Tablets, Journal of Clinical Research and Clinical Trials, BioRes Scientia Publishers. 4(4):1-17. DOI: 10.59657/2837-7184.brs.25.054
Copyright: © 2025 Akash Yadav, this is an open-access article distributed under the terms of the Creative Commons Attribution License, which permits unrestricted use, distribution, and reproduction in any medium, provided the original author and source are credited.
Received: March 11, 2025 | Accepted: August 20, 2025 | Published: August 30, 2025
Abstract
Introduction: Hypertension affects over a billion people worldwide, necessitating efficient and patient-friendly treatment solutions. Propranolol hydrochloride, a commonly used beta-blocker, requires an optimized drug delivery system to enhance therapeutic efficacy and patient compliance. This study aims to formulate a novel mucoadhesive bilayer tablet (MBT) of propranolol hydrochloride, integrating an instant-release layer for rapid action and a mucoadhesive extended-release layer for sustained drug delivery.
Methods: A direct compression method was used to formulate the bilayer tablets. Pre- and post-compression evaluations ensured compliance with quality standards. Optimization was conducted using the Box-Behnken design, a response surface methodology, to determine the ideal formulation parameters for drug release.
Results: The optimized batch, MBT 16, demonstrated desirable immediate and sustained drug release profiles. The formulation exhibited effective pharmacokinetic properties, ensuring steady blood pressure control throughout the day. Additionally, the use of natural excipients enhanced safety and affordability.
Conclusion: The developed mucoadhesive bilayer tablet improves propranolol hydrochloride’s therapeutic profile by reducing dosing frequency while maintaining consistent blood pressure regulation. This innovation enhances patient adherence and opens new possibilities for advanced hypertension management through novel drug delivery systems.
Keywords: mucoadhesive bilayer tablet; propranolol hydrochloride; Box-Behnken design; sustained release; hypertension management
Introduction
Hypertension, often known as high blood pressure, affects over one billion people globally and is a leading cause of cardiovascular disease and mortality. It remains the primary cause of death worldwide. Globally, cardiovascular diseases claimed 17.9 million lives in 2019. Premature deaths in India from heart disease rose from 23.02 million in 1990 to 37 million in 2010, representing a 59% increase in years of life lost. Hypertension is a chronic illness characterised by consistently elevated blood vessel pressure. Often exhibiting no symptoms, high blood pressure is referred to as “the silent killer” [1-3].
A unique method for delivering medications with increased benefits is the use of specialised tablets. Enhancing the bioavailability of the active ingredient via either targeting organ or tissue locations or utilising innovative drug-delivery methods that initiate certain processes is the fundamental idea behind the tailored tablet. Specialised tablets fall into one of two categories: modified-release tablets, which are characterised by their drug-release pattern, or organ-specific tablets, which are characterised by their drug targeting to an organ. Bilayer tablets are a type of dosage in which one or two different types of medicine are mixed together in different levels of compression. A variety of pharmacological and dosage form deficiencies are addressed by the dose type. A bilayer pill frequently contains both an initial and a maintenance dosage [4-6].
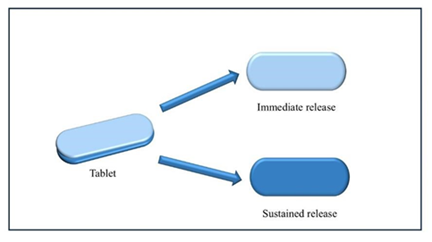
Figure 1: Bilayer tablet.
A nonselective beta-blocker, propranolol hydrochloride (Propranolol HCl) is frequently used to treat a variety of cardiovascular and other disorders. It lowers blood pressure by decreasing the heart's contraction force and tempo. Propranolol is a lipophilic (fat-soluble) medication that can enter the circulation by evading the gastrointestinal tract's lipid bilayer of cell membranes. It is not as well absorbed as other water-soluble drugs, and first-pass metabolism affects its bioavailability. The liver's significant first-pass digestion reduces its bioavailability to 25–35%. Absorption is affected by stomach pH, lipophilicity of the medication, and food intake. In response to norepinephrine and epinephrine, the heart's beta-1 receptors speed up the heartbeat. Propranolol inhibits these receptors, which lowers heart rate (negative chronotropic effect). It can be found in large quantities in the brain, adipose tissues, kidneys, lungs, and heart [7-9].
The main purpose of this study was to develop a new drug delivery system for the efficient treatment of hypertension, a chronic heart condition. Propranolol hydrochloride, a beta-blocker frequently used to treat hypertension, is the focus of this study's bilayer tablet formulation and design. The proposed tablet design consisted of two distinct layers: an immediate release layer and a mucoadhesive extended-release layer. We used the direct compression method to build both layers. For the first dose of the drug to have therapeutic benefits, an instant release layer was designed to deliver it quickly. Simultaneous adhesion of the mucoadhesive extended-release layer to the gastrointestinal mucosa allows for longer-lasting medication release. This dual-layer approach aims to optimize the pharmacokinetic profile of propranolol hydrochloride, which may enhance patient compliance by reducing dose frequency while maintaining constant blood pressure control throughout the day. The positive aspects of employing direct compression as the manufacturing process simplicity, affordability, and scalability make large-scale production of these bilayer tablets desirable [10-11].
The Box-Behnken design is an independent quadratic design that does not contain an embedded factorial or fractional factorial design. In this design, the treatment combinations were at the midpoints of the edges of the process space and at the centre. The research study involves the use of Box Behnken Optimization software leveraging natural Disintegrant Potato starch, natural Mucoadhesive polymer Chia seed mucilage. The incorporation of natural ingredients is an eco-friendly and biocompatible alternative to other synthetic agents of the same category, although the agents have their own synergistic effect. The research insight to boost the efficacy and therapeutic effectiveness of the selected active ingredient [12-14].
Materials and Methods
Propranolol Hydrochloride was obtained as a gift sample from Algen healthcare limited, HPMC K4M and HMPM K15 were purchased from LOBA Chemie. Other excipients used to prepare the bilayer tablets were of standard quality and all chemical reagents used were of analytical grade.
Table 1: Physical and chemical parameters of Propranolol HCl.
| S. No. | Parameter | Predicted Value |
| 1 | Molecular Formula | C16H21NO2 |
| 2 | Molecular Structure |  |
| 3 | IUPAC Name | 1-(naphthalen-1-yloxy)-3-[(propan-2 yl)amino]propan-2-ol |
| 4 | Molecular Weight | 295.85 gm/mol |
| 5 | BCS Class | Class I |
| 6 | pH and pKa | 5-6 pH and 14.09 |
| 7 | Log P | 3.03 or 2.58 |
| 8 | Crystallinity | white, crystalline solid |
| 9 | Melting Point | 96°C |
| 10 | Solubility | Highly soluble in water |
Extraction of Chia Seed Mucilage
The extraction of chia seed mucilage was done according to the methodology adapted by Silveira Ramos et.al. (2021). The seeds were soaked in the Distilled water at a ratio of 1:30 for about 3 hours. After which the mixture was continuously stirred by using magnetic stirred at a temperature of 70-80 ◦C for approximately 1 hour. After extraction the mixture was filtered using a muslin cloth. The extracted material was precipitated with the absolute ethanol. The precipitated mucilage was the subjected towards the hot air oven for drying at temperature 40◦C for about 24 hours [15-16].
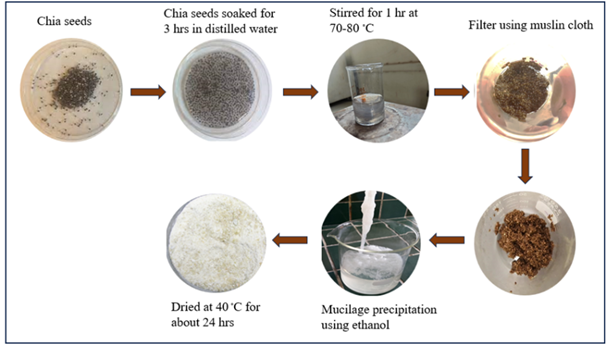
Figure 2: Extraction of chia seed mucilage.
Extraction of Potato Starch
Raw potato was selected, washed and peeled and was cut into small pieces. Blending or crushing was done to form slurry using distilled water. The slurry was then allowed to stand for about 24 hours for sedimentation. Decantation was done to separate the starch and washed with distilled water. Finally, the starch was dried at 40 °C for 48 hours and stored in air tight container [17].
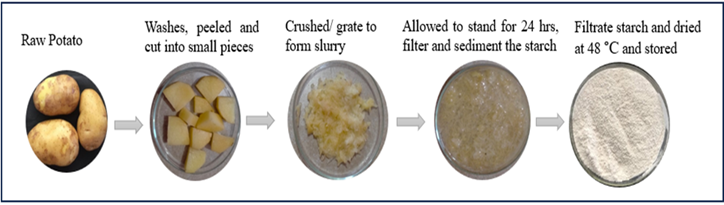
Figure 3: Extraction of potato starch.
Preparation of Aloe Vera Mucilage Powder
Fresh leaves Aloe vera (Aloe barbadensis) was identified and inner leaves mucilage was collected. Excess water was removed and the slake was washed using the acetone. After which the resultant material was soaked in ethyl acetate for precipitation. Resultant material was spread to allow the evaporation of ethyl acetate. Finally dried for about 4 hours and passed to through mesh size 250μm. Store in air tight container [18].
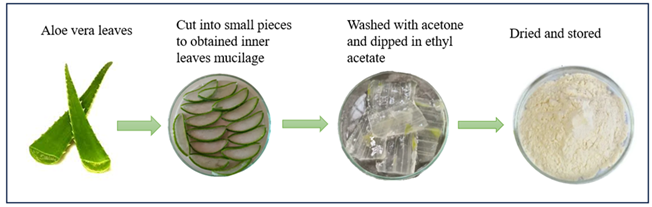
Figure 4: Extraction of Aloe vera mucilage powder.
Table 2: Evaluation parameters of extracted material.
| S. No. | Evaluation | Result | ||
| Chia Seed Mucilage | Aloe Vera Mucilage Powder | Potato Starch | ||
| 1 | Colour | Light brown | Light beige | White |
| 2 | Odour | Slightly earthy | Slightly herbaceous | Odourless |
| 3 | Taste | Neutral taste | Slightly bitter | Tasteless |
| 4 | Appearance | Fine and clumpy | Fine powdery | Fine powder |
| 5 | Nature | Hydrophilic | Hydrophilic | Hydrophilic |
| 6 | Melting point | - | 38 °C | - |
| 7 | pH | 6-7 | 5-7 | 6-7 |
| 8 | Swelling Index | 10ml/g | 6.8ml/g | 7.5 ml/g |
Box-Behnken Design (BBD)
The three levels of a factor 1 being the higher level, 0 being the intermediate level, and -1 being the lower level should be investigated in the box-Behnken design response surface technique. Three independent and three dependent variables were arranged in a polynomial model using BBD and design expert software. The three independent variables, X1, X2, and X3, are the concentration of the disintegrant (potato starch), the impact of the sustain release polymer, and the influence of the mucoadhesive polymer (chia seed mucilage), as indicated in the table 3.
Table 3: The table showing the independent variable and the levels that are selected.
| S. No. | Independent Variable | levels | |
| -1(lower level) | +1(higher level) | ||
| 1 | Concentration of disintegrant (potato starch) | 12 | 20 |
| 2 | effect of mucoadhesive polymer (chia seed mucilage) | 18 | 25 |
| 3 | effect of sustain release polymer | 16 | 20 |
The impact of these three independent variables' changes on the three dependent variables (Y1, Y2, and Y3) are disintegration time, mucoadhesive strength and in-vitro drug release can be studies in the above table 4.
Table 4: Selected Dependent variables.
| S. No. | Dependent Variables | Units |
| 1 | Disintegration Time | Seconds |
| 2 | Mucoadhesive Strength | Grams |
| 3 | In-vitro Drug Release | mg/ml |
On the basis of the selected independent variables and their responses the design expert software suggests 15 formulation batches shown in the table no. 5 by using the suggested data from the software we can formulate the tablets by using suitable compression method.
Table 5: Formulation Runs as per Box Behnken design.
| Runs | Concentration of Disintegrant (Potato Starch) | Effect of Mucoadhesive Polymer (Chia Seed Mucilage) | Effect of Sustained Release Polymer |
| 1 | 20 | 21.5 | 16 |
| 2 | 16 | 21.5 | 18 |
| 3 | 16 | 25 | 16 |
| 4 | 12 | 18 | 18 |
| 5 | 16 | 21.5 | 18 |
| 6 | 12 | 25 | 18 |
| 7 | 20 | 21.5 | 20 |
| 8 | 16 | 18 | 16 |
| 9 | 12 | 21.5 | 16 |
| 10 | 20 | 25 | 18 |
| 11 | 12 | 21.5 | 20 |
| 12 | 16 | 25 | 20 |
| 13 | 16 | 21.5 | 18 |
| 14 | 20 | 18 | 18 |
| 15 | 16 | 18 | 20 |
Preparation of Tablets
The Mucoadhesive bilayer tablets were prepared by using direct compression technique in which the powder blend after lubrication directly compressed using desired compression force and Diameter of die. To prepare a mucoadhesive bilayer tablet, the extended mucoadhesive layer was compressed followed by the compression of burst release layer using Karnavati Tablet punching machine.
Formulation of Immediate Release Layer
The formulation composition of immediate release layer described in the table no. 6 In these the Potato starch is used as a natural super disintegrating agent to enhance the biocompatibility and biodegradability. Lactose is added as a filler to form a desired dosage unit. All the ingredients were weighed accurately and thoroughly mixed using glass mortar and pestle after that lubricated using magnesium stearate mixed for another 10 minutes. The powder blend was compressed using 11 mm die.
Table 6: Formulation Batches for immediate release layer.
| Formulation | Propranolol Hcl (mg) | Potato starch (mg) | Lactose (mg) | Magnesium Stearate (mg) |
| MBT 1 | 30 | 20 | 145 | 5 |
| MBT 2 | 30 | 16 | 149 | 5 |
| MBT 3 | 30 | 16 | 149 | 5 |
| MBT 4 | 30 | 12 | 153 | 5 |
| MBT 5 | 30 | 16 | 149 | 5 |
| MBT 6 | 30 | 12 | 153 | 5 |
| MBT 7 | 30 | 20 | 145 | 5 |
| MBT 8 | 30 | 16 | 149 | 5 |
| MBT 9 | 30 | 12 | 153 | 5 |
| MBT 10 | 30 | 20 | 145 | 5 |
| MBT 11 | 30 | 12 | 153 | 5 |
| MBT 12 | 30 | 16 | 149 | 5 |
| MBT 13 | 30 | 16 | 149 | 5 |
| MBT 14 | 30 | 20 | 145 | 5 |
| MBT 15 | 30 | 16 | 149 | 5 |
Formulation of Mucoadhesive layer
The formulation composition of mucoadhesive extended-release layer described in the table no. 7 Chia seed mucilage is used as a mucoadhesive polymer and aloevera mucilage is used as a binding agent. While the HPMC K4 M and HPMC K15 is used as a Matrix former to sustain the drug release. Microcrystalline cellulose is used as diluent. All the ingredients were properly mixed thoroughly and lubricated with Talc. Mucoadhesive layer was compressed in 11 mm die followed by compression of immediate release layer [19-23].
Table 7: Formulation batches for mucoadhesive layer.
| Formulation | Propranolol Hcl (mg) | Chia seed mucilage (mg) | HPMC K4M (mg) | HPMC K15 (mg) | MCC (mg) | Aloe-Vera (mg) | Talc (mg) |
| MBT 1 | 50 | 21.5 | 16 | 10 | 137.5 | 10 | 5 |
| MBT 2 | 50 | 21.5 | 18 | 10 | 135.5 | 10 | 5 |
| MBT 3 | 50 | 25 | 16 | 10 | 134 | 10 | 5 |
| MBT 4 | 50 | 18 | 18 | 10 | 139 | 10 | 5 |
| MBT 5 | 50 | 21.5 | 18 | 10 | 135.5 | 10 | 5 |
| MBT 6 | 50 | 25 | 18 | 10 | 132 | 10 | 5 |
| MBT 7 | 50 | 21.5 | 20 | 10 | 133.5 | 10 | 5 |
| MBT 8 | 50 | 18 | 16 | 10 | 141 | 10 | 5 |
| MBT 9 | 50 | 21.5 | 16 | 10 | 137.5 | 10 | 5 |
| MBT 10 | 50 | 25 | 18 | 10 | 132 | 10 | 5 |
| MBT 11 | 50 | 21.5 | 20 | 10 | 133.5 | 10 | 5 |
| MBT 12 | 50 | 25 | 20 | 10 | 130 | 10 | 5 |
| MBT 13 | 50 | 21.5 | 18 | 10 | 135.5 | 10 | 5 |
| MBT 14 | 50 | 18 | 18 | 10 | 139 | 10 | 5 |
| MBT 15 | 50 | 18 | 20 | 10 | 137 | 10 | 5 |
Pre-compressional Parameter
Pre compressional parameters involve the bulk characterization, powder flow property, solubility, melting point etc. [24-26].
Angle of Repose
It is the angle at which the granular pile can rest on the horizontal surface without fall. The technique measures the resistance between the material particles and critical parameter to measure the flowability and granular packing. Pile forming method was used to identify angle of repose in which a funnel was positioned to hold and release the material slowly onto a smooth flat surface. The height and radius of pile formed by material was notes and the θ was measured using the given equation.
Formula: 
Table 8: Angle of Repose.
| S. No. | Flow Property | Angle of Repose |
| 1 | Excellent | 25-30 |
| 2 | Good | 31-35 |
| 3 | Fair | 36-40 |
| 4 | Passable | 41-45 |
| 5 | Poor | 46-55 |
| 6 | Very poor | 56-65 |
| 7 | Very, very poor | >66 |
Bulk Density
Bulk density is an important physical parameter of powder flow property. It is the density of powder in its natural state and can be calculated by the mass to volume ratio expressed in gm/ml or gm/cm3. It was measured using cylindrical container method in which measuring cylinder was poured with pre-weighed powder material and the volume was directly observed, finally the bulk density was calculated using the formula.
Formula: Bulk density = Mass of substance / Volume of substance
Tapped Density
It is the density of powder after the particular number of mechanically tapping the powder material and calculated by dividing the mass of powder mass by its final volume after tapping. It helps to measure the powder compressibility and flowability expressed in gm/cm3.
Formula: Tapped density = Mass of substance / Final volume after tapping
Compressibility Index:
Carr’s index measures the powder compressibility which defines the tablet strength and stability. If it is less than 15 indicates the good flowability and if it is more than 25 indicates the poor flowability.
Formula: Carr’s Index = Tapped Density - Bulk Density / Tapped Density × 100
Table 9: Flow properties as per Carr’s Index.
| S. No. | Carr’s Index | Flowability |
| 1 | 5-15 | Excellent |
| 2 | 12-16 | Good |
| 3 | 18-21 | Fair possible |
| 4 | 23-35 | Poor |
| 5 | 33-38 | Very poor |
| 6 | >40 | Very, very poor |
Hausner’s Ratio
It is a critical parameter of powder flow property and measures the flowability or granular material. Low Hausner’s ratio indicates the less interaction between the granular particles and material is more easily flowable.
Formula: Hausner’ s ratio = Tapped density / Bulk density
Table 10: Flow properties as per Hausner’s Ratio.
| S. No. | Hausner’ ratio | Flowability |
| 1 | 1.05 - 1.18 | Excellent |
| 2 | 1.14 - 1.20 | Good |
| 3 | 1.22 - 1.26 | Fair possible |
| 4 | 1.30 – 1.54 | Poor |
| 5 | 1.50 – 1.61 | Very poor |
| 6 | >1.67 | Very, very poor |
Particle Size Analysis
Particle size determination of powders is a critical parameter which directly affect the quality, flowability, stability and performance of the substances. Smaller particle size shows higher surface area and have greater absorbance. Sieve method was used to define the particle size of the mixture.
Table 11: Methods for determining particle size of solids.
| S. No. | Techniques | Particle size (mm) |
| 1 | Microscopic | 1-100 |
| 2 | Sieve | >5 |
| 3 | Sedimentation | >1 |
| 4 | Elutriation | 1-50 |
| 5 | Centrifugal | <50> |
| 6 | Permeability | >1 |
| 7 | Light Scattering | 0.5-50 |
Solubility Studies
The amount of material that dissolves in a solution to form a saturated solution at a certain temperature and pressure is known as solubility. The greatest volume or mass of the solute that dissolves in a certain volume or mass of a solvent is how solubility is stated. The shake-flask method was used to determine the solubility:
- The method involves addition of compound to a medium and shaking it to achieve saturation after giving particular temperature.
- After formation of supersaturated solution, filtration was done followed by slow cooling and shaking.
- Sample was then analysed (diluted if needed) to determine the solute content using appropriate method.
Table 12: Characterization of Solubility.
| Descriptive Term | Parts of Solvent Required for 1 Part of Solute | G/L In Water | M=400 Mol/L in Water | M=40000 Mol/L in Water |
| Very Soluble | ≤1 | ≥1000 | ≥2,5 | ≥0,025 |
| Freely Soluble | 1 to 10 | 1000 to 100 | 2,5 to 0,25 | 0,025 to 0,0025 |
| Soluble | 10 to 30 | 100 to 33 | 0,25 to 0,08 | 0,0025 to 0,0008 |
| Sparingly Soluble | 30 to 100 | 33 to 10 | 0,08 to 0,025 | 0,0008 to 0,00025 |
| Slightly Soluble | 100 to 1000 | 10 to 1 | 0,025 to 0,0025 | 0,00025 to 0,0000025 |
| Very Slightly Soluble | 1000 to 10,000 | 1 to 0,1 | 0,0025 to 0,00025 | 0,000025 to 0,0000025 |
| Practically Insoluble, or Insoluble | ≥10,000 | ≤0,1 | ≤0,00025 | ≤0,0000025 |
Melting Point Determination
It is the temperature at which the substance starts to melt or changes its state from solid to liquid. It was determined by using electrically heated melting point apparatus.
Loss on Drying
LOD is the resultant weight of the compound expressed in percentage (w/w) to determine the moisture content in the sample compound. Following steps were used to determine the LOD:
- Sample was accurately weighed.
- Sample was heated till it gets completely dry.
- Dried sample was again weighed and difference was calculated.

Standard Calibration Curve
A calibration curve is used to compute the limit of detection, the limit of quantitation, and the concentration of an unknown material. Using a series of standard samples at various concentrations, the instrumental response is used to build the curve. Unknown concentrations can then be predicted by fitting the data with a function.
- Stock solution of known (1000 μg/ml) concentration was prepared by dissolving 100mg into 100ml of 0.1 N hydrochloric acid.
- Second stock solution (100 μg/ml) prepared by pipetting 10 ml of above solution and diluted up to 100ml with the same solvent.
- Dilutions of different strength was prepared and analysed using UV spectrophotometer.
Post Compressional Parameters
Organoleptic Characters
The organoleptic parameters were studied by visually evaluating tablets properties like colour and odour.
Thickness
To assess the tablet's homogeneity in size and shape, its thickness was examined.
Methods: A Vernier calliper was used to measure the tablet's thickness.
Hardness
A Monsanto hardness tester was used to measure the tablets' hardness. On the testing platform, each tablet was positioned separately, and pressure was applied until the tablets broke. The hardness value was determined by measuring the force needed to break each tablet. This technique made it possible to assess the tablets' resistance to mechanical stress precisely.
Friability
The Roche Friabilator was used to assess the produced formulations' friability. After a pre-weighed sample of tablets was put in the friability testing and rotated for 100 revolutions, the tablets were cleaned and weighed again. The following formula was used to determine the tablets' friability:

Weight Variation
Twenty tablets were weighed separately, the average weight was determined, and the weight of each tablet was compared to the average weight to perform the weight variation test.
Table 13: Uniformity of Weight and Percentage Deviation.
| S. No. | USP | Max % Difference Allowed | IP / BP |
| 1 | 130mg > or less | ±10% | 80mg > or less |
| 2 | 130mg > 324 mg | ±7.5% | 80mg-250mg |
| 3 | 324 mg < or> | ±5% | 250mg < or> |
Content Uniformity Test
A content/potency assay was used in content uniformity testing to ascertain the amount of active substance present in several samples taken during the batch. The UV was used to measure the amount of drug and the consistency of the material. Ten tablets were selected randomly and assay was performed to check individual content of active ingredient in each tablet. The potency of nine out of ten pills must be within 1% to 15% of the drug's stated content. There can only be one tablet within a quarter.
Swelling Index Study
The swelling index of a tablet measures how much its volume increases over a specific amount of time as a result of absorbing a liquid, often a dissolving medium. The swelling state of the polymer is a key factor affecting the tablet's bio adhesion. Until the glue hits a threshold where too much hydration causes the adhesive quality to suddenly drop owing to unwinding at the polymer/tissue interface, the degree of hydration will strengthen the binding.
Mucoadhesive Strength and Time
The force that holds a mucoadhesive substance like a gel or polymer to the mucosal surface like the mucosa of the mouth, nose, or stomach is known as mucoadhesive strength. The mucoadhesive strength was determined by using ex vivo test. Goat intestine was cut to obtain a small piece and pasted on a petri dish using adhesive. The intestine membrane was moistened with 2-3 drops of 0.01 N HCl and the tablet was tied with a thread with physical balance on one side. The total weight required to detach the tablet from the intestine membrane was noted as mucoadhesive strength.
Disintegration Test of Tablets
The disintegration test shows how quickly and effectively a tablet disintegrates into smaller pieces in a liquid. The disintegration test is performed to confirm that the body is absorbing the medicine as intended. the process for figuring out how long pills take to dissolve. Initially, the disintegration apparatus was filled with distilled water and kept at 37°C± 2°C. The six tablets from each formulation are then chosen at random and put one at a time in each of the six cylinders of a disintegration test device. After that, the device was activated, which caused the basket to move up and down. The time it takes for each pill to completely dissolve is then recorded. The average amount of time it took for the pills to dissolve.
In Vitro Dissolution Test
The medication release profile is ascertained using the in-vitro dissolution test. This is how the mucoadhesive bilayer tablets are tested for in-vitro dissolution. The USP type II paddle-type equipment was used to conduct the in-vitro dissolving test for the bilayer tablets. The paddle's speed was set at 50 rpm, and the water bath's temperature was kept at 37°C +/- 0.5°C. The tank that serves as a dissolving media was filled with 900 milliliters of 0.1 N HCL. A tablet chosen at random is put in the dissolving test apparatus's vessel. The sink state was maintained while a 10-milliliter sample was taken out of the vessel at various prearranged intervals. After the samples were filtered, they were analysed at λmax 290nm using a UV-visible spectrophotometer. The absorbance was recorded, and the percentage of drug release and cumulative drug release was computed.
Stability Studies
Stability studies are a crucial assessment metric that aids in figuring out a product's shelf life or how external factors may impact the final product's quality over time. ICH quick study criteria were used to examine the stability of all salbutamol sulphate tablet formulations for a period of one month. Each sample was securely wrapped in aluminium foil and placed in airtight glass containers. These tablets were exposed to three different temperature settings. Tablets were removed from storage at 10-, 20-, and 30-day intervals for examination, with a focus on physical attributes, drug concentration, and segregation patterns [27-30].
Result and Discussion
Organoleptic properties of Propranolol HCl
Table 14: Organoleptic properties of Propranolol HCl.
| S. No. | Organoleptic Characteristics | Result |
| 1 | Colour | White |
| 2 | Odour | Odourless |
| 3 | Taste | Slightly bitter |
| 4 | Nature | Lipophilic |
| 5 | Crystallinity | Crystalline Solid |
Melting Points
While studied done on the Propranolol hcl, the melting point was determined using melting point apparatus was found to be 148.2°C.
Calibration Curve
Table 15: Calibration curve of Propranolol hcl in 0.1 N HCL at λmax 290nm.
| S. No. | Concentration (µg/ml) | Absorbance (λmax 290 nm) |
| 1 | 0 | 0 |
| 2 | 2 | 0.218 |
| 3 | 4 | 0.339 |
| 4 | 6 | 0.472 |
| 5 | 8 | 0.591 |
| 6 | 10 | 0.711 |
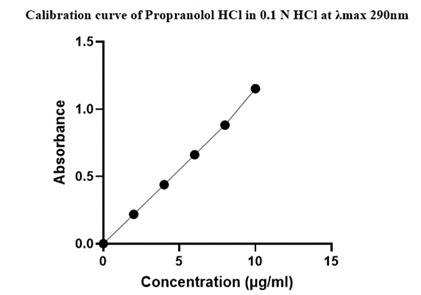
Figure 5: Calibration curve of Propranolol HCL in 0.1 N HCL.
Pre-compressional Evaluation
The prepared powder blend for mucoadhesive bilayer tablets were characterized for Angle of repose, Bulk density, tapped density, Carr’s index and Hausner’s ratio for both immediate and mucoadhesive layer which are shown in table. Angle of repose of all batches was within 30°-36°, Carr’s index of all batches was within 7.40-13.20 and Hausner’s ratio of all batches was found within 1.08-1.15 which indicate good flow property of granules.
Table 16: Pre-compressional data of the formulation batches of powder blend.
| Formulation batch | Angle of Repose(θ) | Bulk Density (gm/ cm3) | Tapped Density (gm/ cm3) | Hausner’s Ratio (HR) | Carr’s Index (CI) |
| MBT 1 | 34.56 | 0.49 | 0.56 | 1.14 | 12.5 |
| MBT 2 | 33.19 | 0.50 | 0.54 | 1.08 | 7.40 |
| MBT 3 | 31.62 | 0.48 | 0.53 | 1.10 | 9.43 |
| MBT 4 | 34.17 | 0.49 | 0.56 | 1.14 | 12.5 |
| MBT 5 | 32.87 | 0.46 | 0.53 | 1.15 | 12.5 |
| MBT 6 | 33.51 | 0.46 | 0.53 | 1.15 | 13.20 |
| MBT 7 | 31.38 | 0.51 | 0.57 | 1.11 | 10.52 |
| MBT 8 | 36.43 | 0.47 | 0.54 | 1.14 | 12.9 |
| MBT 9 | 36.15 | 0.46 | 0.53 | 1.15 | 13.20 |
| MBT 10 | 30.71 | 0.51 | 0.57 | 1.11 | 10.52 |
| MBT 11 | 34.56 | 0.49 | 0.54 | 1.10 | 9.25 |
| MBT 12 | 30.96 | 0.47 | 0.53 | 1.12 | 11.32 |
| MBT 13 | 35.81 | 0.50 | 0.57 | 1.14 | 12.28 |
| MBT 14 | 32.87 | 0.46 | 0.52 | 1.13 | 11.53 |
| MBT 15 | 30.10 | 0.51 | 0.56 | 1.09 | 8.92 |
Post-compressional Evaluation
Shape and Size
On the evaluation of the Propranolol hcl formulated bilayer tablets have the circular in shape and the size of the tablets was found to be 0.65\pm 0.05 cm.
Table 17: Post-compressional data of the formulation batches.
| Formulation Batch | Weight Variation (mg) | Thickness (mm) | Hardness (kg/cm2) | Swelling Index (ml/g) | Mucoadhesive Strength (gm) | Disintegration time (sec) | Friability (%) |
| MBT 1 | 451.1 | 4.50 | 6.21 | 8.9 | 29 | 14.7 | 0.13 |
| MBT 2 | 447.6 | 4.51 | 5.78 | 8.3 | 31 | 12.9 | 0.17 |
| MBT 3 | 460.4 | 4.54 | 5.23 | 9.1 | 24 | 12.7 | 0.19 |
| MBT 4 | 445.9 | 4.11 | 5.21 | 7.8 | 27 | 17 | 0.11 |
| MBT 5 | 454.3 | 4.21 | 5.10 | 9.1 | 33 | 12.2 | 0.14 |
| MBT 6 | 443.8 | 4.24 | 6.55 | 8.8 | 29 | 19.6 | 0.19 |
| MBT 7 | 447.7 | 4.55 | 5.32 | 8.6 | 24 | 15 | 0.12 |
| MBT 8 | 446.3 | 4.53 | 4.85 | 8.9 | 30 | 12.9 | 0.12 |
| MBT 9 | 461.1 | 4.10 | 6.11 | 8.7 | 26 | 17.2 | 0.11 |
| MBT 10 | 454.7 | 4.41 | 5.61 | 9.2 | 24 | 19 | 0.14 |
| MBT 11 | 447.5 | 4.48 | 5.91 | 8.3 | 23 | 15.6 | 0.15 |
| MBT 12 | 462.9 | 4.46 | 6.12 | 8.5 | 28 | 13.7 | 0.13 |
| MBT 13 | 447.4 | 4.32 | 4.55 | 9.1 | 35 | 13.2 | 0.12 |
| MBT 14 | 460.7 | 4.27 | 4.91 | 9.1 | 27 | 14 | 0.11 |
| MBT 15 | 447.9 | 4.27 | 5.74 | 8.6 | 30.5 | 12.6 | 0.21 |
All the prepared tablet batches (MBT 1 - MBT 15) were evaluated for post compression parameters and results obtained in the range are sufficient for mucoadhesive bilayer tablets shown in the table no. 17. Hardness ranged between 4.5-6.5kg/cm2, thickness of all tablet batches results from 4.27-4.55mm, friability was found to be in range of 0.11-0.19% which is less than 1% showed good mechanical strength, weight variation test results in between 445.9-462.9mg, swelling index found in 8.3-9.1 ml/gm, mucoadhesive strength results from 14-18.2gm, mucoadhesive time, disintegration time for immediate release layer ranged between 12.2-19.6 seconds. The content uniformity test results ranged between 1.9-2.5% for all the prepared batches.
Stability Studies
The stability studies were done under the accelerated conditions for 1 month and 3 months (40°C ± 5°C / 70% RH ± 5% RH). The propranolol hcl mucoadhesive tablets were evaluated for colour, texture, moisture content, mucoadhesive strength etc., and the results demonstrated that the tablets remained intact physically and there are no visible changes observed. The tablets showed minimal degradation and the in vitro studies suggested that the there is no significant effect on the drug release of both layers.
In-vitro Dissolution Studies
The amount drug release was analysed at a pre-determined time intervals using a USP type II dissolution test apparatus. The obtained results for cumulative amount of drug release are shown in the Table 18.
Table 18: In vitro dissolution test data of the Propranolol hcl Mucoadhesive bilayer tablets.
| Formulation batch | 5 min | 10 min | 20 min | 30 min | 40 min | 60 min | 120 min | 180 min | 240 min | 480 min | 720 min |
| MBT 1 | 4.458 | 9.364 | 18.273 | 25.582 | 34.546 | 41.164 | 46.564 | 51.220 | 56.342 | 73.348 | 91.924 |
| MBT 2 | 5.478 | 8.345 | 17.992 | 25.188 | 37.984 | 40.376 | 45.498 | 50.047 | 55.057 | 71.574 | 96.756 |
| MBT 3 | 4.795 | 8.487 | 17.774 | 24.886 | 35.488 | 43.761 | 49.318 | 54.249 | 58.674 | 76.276 | 89.245 |
| MBT 4 | 5.134 | 6.697 | 16.581 | 23.213 | 37.162 | 44.826 | 48.697 | 53.863 | 59.761 | 77.689 | 96.524 |
| MBT 5 | 3.420 | 7.985 | 18.068 | 25.295 | 37.702 | 40.588 | 45.651 | 51.216 | 57.754 | 75.802 | 96.752 |
| MBT 6 | 5.324 | 8.681 | 18.193 | 25.472 | 36.664 | 41.944 | 47.841 | 52.625 | 57.932 | 76.215 | 95.156 |
| MBT 7 | 4.951 | 9.645 | 19.437 | 27.211 | 38.874 | 44.488 | 49.366 | 54.302 | 60.871 | 79.135 | 91.102 |
| MBT 8 | 6.358 | 8.125 | 16.345 | 22.953 | 32.687 | 45.906 | 50.921 | 56.013 | 61.897 | 80.465 | 90.561 |
| MBT 9 | 5.753 | 9.126 | 17.679 | 26.756 | 37.314 | 43.512 | 48.357 | 53.192 | 59.754 | 77.684 | 89.442 |
| MBT 10 | 5.951 | 8.644 | 19.549 | 27.268 | 39.786 | 43.525 | 49.987 | 54.985 | 60.175 | 78.442 | 97.779 |
| MBT 11 | 4.158 | 9.146 | 16.993 | 24.792 | 35.907 | 44.284 | 48.684 | 53.549 | 59.121 | 76.781 | 94.304 |
| MBT 12 | 6.147 | 8.464 | 18.715 | 26.201 | 37.431 | 42.435 | 49.952 | 55.942 | 61.248 | 80.121 | 94.353 |
| MBT 13 | 3.963 | 6.846 | 17.395 | 24.353 | 34.617 | 40.705 | 43.68 | 51.048 | 57.874 | 75.156 | 95.979 |
| MBT 4 | 4.846 | 9.866 | 19.372 | 27.128 | 38.546 | 42.256 | 46.314 | 50.944 | 55.357 | 71.653 | 92.104 |
| MBT 15 | 4.782 | 7.891 | 16.227 | 22.717 | 37.524 | 45.435 | 50.462 | 54.508 | 59.849 | 77.837 | 92.856 |
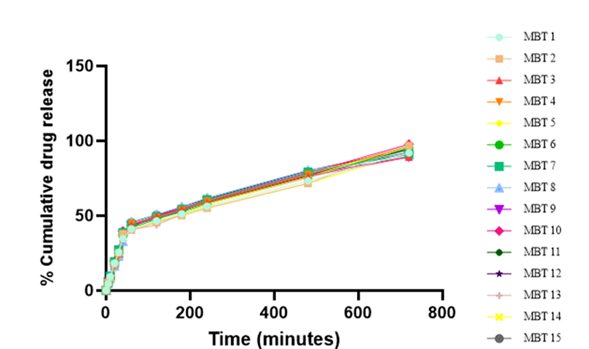
Figure 6: Percent drug release for all the batches MBT 1-MBT 15.
Preparation of Propranolol Hcl Mucoadhesive Bilayer Tablets with Responses
Table 19: The BBD composition of Propranolol hcl Mucoadhesive bilayer tablets formulations and their measured responses.
| Formulation Batch | Independent Variables | Dependent Variables | ||||
| Concentration of Disintegrant | Effect of Mucoadhesive Polymer | Effect of Sustain Release Polymer | Disintegration Time (Seconds) | Mucoadhesive Strength (Grams) | In-Vitro Dissolution Time (%) | |
| MBT 1 | 20 | 21.5 | 16 | 14.7 | 18.2 | 91.924 |
| MBT 2 | 16 | 21.5 | 18 | 12.9 | 17.9 | 96.756 |
| MBT 3 | 16 | 25 | 16 | 12.7 | 14 | 89.245 |
| MBT 4 | 12 | 18 | 18 | 17 | 12.7 | 96.524 |
| MBT 5 | 16 | 21.5 | 18 | 12.2 | 18.3 | 96.752 |
| MBT 6 | 12 | 25 | 18 | 19.6 | 15.1 | 95.156 |
| MBT 7 | 20 | 21.5 | 20 | 15 | 18.2 | 91.102 |
| MBT 8 | 16 | 18 | 16 | 12.9 | 11.9 | 90.561 |
| MBT 9 | 12 | 21.5 | 16 | 17.2 | 18.6 | 89.442 |
| MBT 10 | 20 | 25 | 18 | 19 | 11.9 | 97.792 |
| MBT 11 | 12 | 21.5 | 20 | 15.6 | 16.6 | 94.304 |
| MBT 12 | 16 | 25 | 20 | 13.7 | 14.1 | 94.353 |
| MBT 13 | 16 | 21.5 | 18 | 13.2 | 17.4 | 95.979 |
| MBT 14 | 20 | 18 | 18 | 14 | 12.9 | 92.104 |
| MBT 15 | 16 | 18 | 20 | 12.6 | 16.3 | 92.856 |
Response 1: Disintegration Time for Immediate Release Layer
3D and 2D contour plot images show that an increase in the concentration of Disintegrant leads to decrease disintegration time but only at optimum value. Increase in the mucoadhesive polymer also increases the disintegration time for the tablet which is a significant factor but ideally it should not have any kind of interaction. It could be because of any noise. Sustain release polymer doesn’t have any significant effect on the disintegration time.
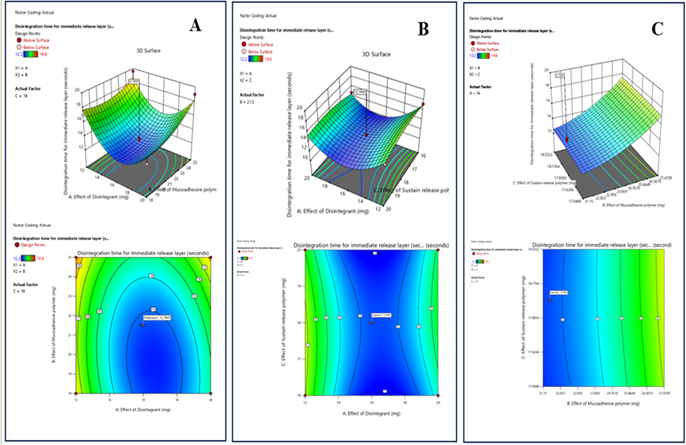
Figure 7: The 2D contour plot and 3D surface graph shows that how disintegration time for immediate release layer is affected by factors X1 (effect of disintegrant), X2, (effect of mucoadhesive polymer), X3 (effect of sustained release polymer).
ANOVA for Quadratic Model Response 1: Disintegration Time for Immediate Release Layer
The obtained model for ANOVA is significant and lack of fit is non-significant which represent good model alignment. The ANOVA for Disintegration time is shown in the table no. There is only a 3.05% chance that an F-value this large could occur due to noise. In this case B, A² are significant model terms. Values greater than 0.1000 indicate the model terms are not significant.
Table 20: ANOVA for Disintegration time for immediate release layer (Response 1).
| Source | Sum of Squares | df | Mean Square | F-Value | p-Value | |
| Model | 72.93 | 9 | 8.10 | 6.08 | 0.0305 | Significant |
| A-Effect of Disintegrant | 5.61 | 1 | 5.61 | 4.21 | 0.0955 | |
| B-Effect of Mucoadhesive polymer | 9.03 | 1 | 9.03 | 6.77 | 0.0481 | |
| C-Effect of Sustain release polymer | 0.0450 | 1 | 0.0450 | 0.0337 | 0.8615 | |
| AB | 1.44 | 1 | 1.44 | 1.08 | 0.3464 | |
| AC | 0.9025 | 1 | 0.9025 | 0.6766 | 0.4482 | |
| BC | 0.4225 | 1 | 0.4225 | 0.3168 | 0.5979 | |
| A² | 48.97 | 1 | 48.97 | 36.71 | 0.0018 | |
| B² | 3.63 | 1 | 3.63 | 2.72 | 0.1599 | |
| C² | 2.27 | 1 | 2.27 | 1.70 | 0.2493 | |
| Residual | 6.67 | 5 | 1.33 | |||
| Lack of Fit | 6.14 | 3 | 2.05 | 7.78 | 0.1161 | Not Significant |
| Pure Error | 0.5267 | 2 | 0.2633 | |||
| Cor Total | 79.60 | 14 |
Response 2: Mucoadhesive Strength
The 3D and 2D Surface plot studies shows how the mucoadhesive polymer, disintegrant and sustain release polymer affect the mucoadhesive strength of tablet. Higher mucoadhesive polymer represent higher strength, while disintegrant has minimum effect. Red and orange colour shows higher mucoadhesive strength.
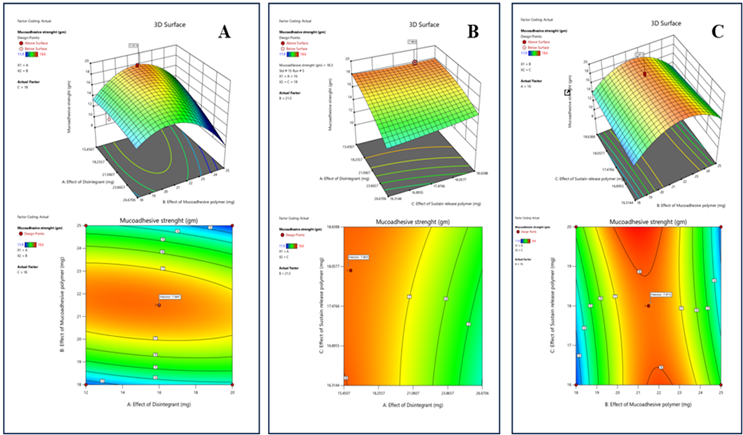
Figure 8: The 2D contour plot and 3D surface graph shows that how Mucoadhesive strength is affected by factors X1, X2, X3
ANOVA for Quadratic Model Response 2: Mucoadhesive Strength
The model appears significant with F-value 6.56 and there is only 2.60% chance that F value this large occur due to noise. In this case B² is a significant model term. Means increasing the mucoadhesive polymer leads to increase in mucoadhesive strength while the increasing the mucoadhesive polymer leads to increase in disintegration time. Sustain release polymer have negligible effect on mucoadhesive strength.
Table 21: ANOVA for Mucoadhesive strength (Response 2).
| Source | Sum of Squares | df | Mean Square | F-Value | p-Value | |
| Model | 84.74 | 9 | 9.42 | 6.56 | 0.0260 | Significant |
| A-Effect of Disintegrant | 0.4050 | 1 | 0.4050 | 0.2823 | 0.6180 | |
| B-Effect of Mucoadhesive polymer | 0.0113 | 1 | 0.0113 | 0.0078 | 0.9329 | |
| sC-Effect of Sustain release polymer | 0.2813 | 1 | 0.2813 | 0.1960 | 0.6765 | |
| AB | 2.89 | 1 | 2.89 | 2.01 | 0.2151 | |
| AC | 1.0000 | 1 | 1.0000 | 0.6969 | 0.4419 | |
| BC | 7.02 | 1 | 7.02 | 4.89 | 0.0779 | |
| A² | 0.3801 | 1 | 0.3801 | 0.2649 | 0.6287 | |
| B² | 71.35 | 1 | 71.35 | 49.73 | 0.0009 | |
| C² | 0.4631 | 1 | 0.4631 | 0.3228 | 0.5945 | |
| Residual | 7.17 | 5 | 1.43 | |||
| Lack of Fit | 6.77 | 3 | 2.26 | 11.09 | 0.0838 | Not Significant |
| Pure Error | 0.4067 | 2 | 0.2033 | |||
| Cor Total | 91.92 | 14 |
Response 3: In Vitro Drug Release
The sustain release polymer greatly affect the in vitro drug release rate, higher sustained release polymer promote slow release of drug from dosage unit but decreases the in vitro drug release for desired period while the mucoadhesive polymer also affect the drug release but at the optimum. Orange region indicates the balanced level of both sustained release polymer as well as mucoadhesive polymer. Sustained release polymer helps to improve strength and extend the release but can negatively impact disintegration of tablet.
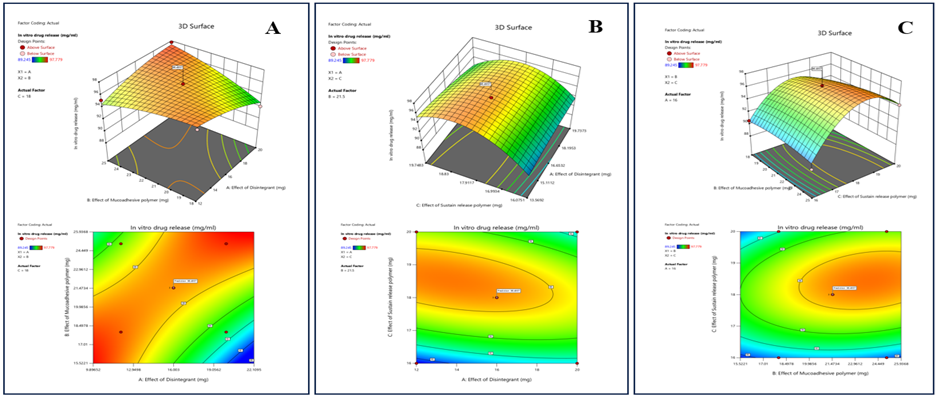
Figure 9: The 2D contour plot and 3D surface graph shows that how In vitro drug release is affected by factors X1, X2, X3.
ANOVA for Quadratic Model Response 3: In Vitro Drug Release
P-values less than 0.0500 indicate model terms are significant. In this case C, AB, AC, C² are significant model terms. There is non-significant lack of fit which represent model is aligned. And is there is only a 0.43% chance that an F-value this large could occur due to noise.
Table 22: ANOVA for in vitro drug release (Response 3).
| Source | Sum of Squares | df | Mean Square | F-value | p-value | |
| Model | 108.25 | 9 | 12.03 | 14.71 | 0.0043 | Significant |
| A-Effect of Disintegrant | 0.7919 | 1 | 0.7919 | 0.9688 | 0.3702 | |
| B-Effect of Mucoadhesive polymer | 2.52 | 1 | 2.52 | 3.08 | 0.1396 | |
| C-Effect of Sustain release polymer | 16.37 | 1 | 16.37 | 20.02 | 0.0066 | |
| AB | 12.40 | 1 | 12.40 | 15.17 | 0.0115 | |
| AC | 8.08 | 1 | 8.08 | 9.88 | 0.0256 | |
| BC | 1.98 | 1 | 1.98 | 2.42 | 0.1805 | |
| A² | 1.25 | 1 | 1.25 | 1.53 | 0.2704 | |
| B² | 1.01 | 1 | 1.01 | 1.23 | 0.3177 | |
| C² | 65.75 | 1 | 65.75 | 80.43 | 0.0003 | |
| Residual | 4.09 | 5 | 0.8174 | |||
| Lack of Fit | 3.69 | 3 | 1.23 | 6.14 | 0.1433 | Not Significant |
| Pure Error | 0.4004 | 2 | 0.2002 | |||
| Cor Total | 112.34 | 14 |
As we studied the box behnken design we put the responses that we analysed from the evaluation studies as shown in the table no. 19. then the box behnken design optimized the responses and give the optimized batch of formulation and the optimized batch responses and the formulation are shown in table.
Table 23: Formulation of optimized batch from BBD (MBT 16).
| S. No. | Ingredient | Quantities (In mg) |
| Immediate release layer (200mg) | ||
| 1 | Propranolol HCl | 30 |
| 2 | Potato starch | 12.35 |
| 3 | Lactose | 152.65 |
| 4 | Magnesium stearate | 5 |
| Mucoadhesive extended-release layer (250mg) | ||
| 1 | Propranolol HCl | 50 |
| 2 | Chia seed | 21.03 |
| 3 | HPMC K4 M | 16.34 |
| 4 | HPMC K15 | 10 |
| 5 | Aloe vera | 10 |
| 6 | Microcrystalline cellulose | 137.63 |
| 7 | Talc | 5 |
Table 24: Pre compressional data of optimized batch (MBT 16).
| S. No. | Pre-compressional Evaluation Parameter | Results |
| 1 | Bulk Density | 0.45 |
| 2 | Tapped Density | 0.49 |
| 3 | Hausner’s Ratio | 1.08 |
| 4 | Carss Index | 8.163 |
| 5 | Angle of Repose | 32 |
Table 25: Post compressional data of optimized batch (MBT 16).
| S. No. | Post-compression Evaluation Parameter | Results |
| 1 | Weight Variation | 445.9 mg |
| 2 | Thickness | 4.32 mm |
| 3 | Hardness | 3.357 kg/cm2 |
| 4 | Swelling Index | 8.4 ml/gm |
| 5 | Mucoadhesive Strength | 18.2 gm |
| 6 | Disintegration Time | 15.8 seconds |
| 7 | Friability | 0.11 % |
| 8 | % Drug Release | 95.981 % |
Table 26: In vitro drug release for optimized batch (MBT 16).
| Formulation batch | 5 min | 10 min | 20 min | 30 min | 40 min | 60 min | 120 min | 180 min | 240 min | 480 min | 720 min |
| MBT 1 | 5.458 | 9.304 | 19.273 | 23.672 | 37.586 | 44.194 | 49.964 | 59.220 | 66.342 | 76.348 | 95.981 |
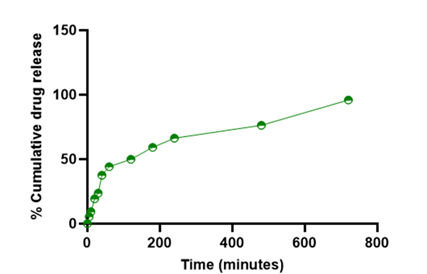
Figure 10: Percent drug release of batch MBT 16 (optimised batch).
The obtained Percent drug release of batch MBT 16 (optimised batch) has 95.981 % of drug release in12 hrs. (720 minutes), and the optimized batch was evaluated for all the pre and post compressional parameters required for quality control of dosage form and the obtained results was found between satisfied range.
Conclusion
The presented works demonstrate that the tablets containing the propranolol hydrochloride can be desirably prepared as a mucoadhesive bilayer tablets for the management of hypertension. The tablets were evaluated for all the pre and post compressional parameters. The prepared tablets meet all the basic requirements and necessary standards of quality dosage form. Specialised tablets can be further studied for better patient compliance and scale up processes. The study also determines the incorporation of natural ingredients for cost effective and safe studies. The study explores the need of immediate release of drug in the systemic circulation while the supportive maintenance dose for extended period of time for better management of disease. The study aimed to find the optimized batch using the suitable response surface methodology, Box Behnken design. There was selection of three independent factors for their respective responses. The obtained optimised batch MBT 16 showed the desired outcome showed 95.981% of release in 720 minutes. The optimized batch was also evaluated for the various post compressional parameter, Weight variation (445.9 mg), Thickness (4.32 mm), Hardenss (3.357 kg/cm2), Swelling index (8.4 ml/gm), Mucoadhesive strength (18.2 gm), Disintegration time (15.8 seconds), Friability (0.11%).
Declarations
Acknowledgement
I would like to show my sincere gratitude towards IPS Academy College of Pharmacy for providing the necessary requirements and facilities throughout the study. Lastly, I would like to express my appreciation to all my colleagues and peers for their helpful discussions and moral support, which contributed to the success of this work.
Conflict of Interest
The authors declare no conflict of interest.
References
- Upshaw, J. N., Parker, S., Gregory, D., Koethe, B., Vest, A. R., et al. (2023). The Effect of Tablet Computer-Based Telemonitoring Added to An Established Telephone Disease Management Program on Heart Failure Hospitalizations: The Specialized Primary and Networked Care in Heart Failure (SPAN-CHF) III Randomized Controlled Trial. American Heart Journal, 260:90-99.
Publisher | Google Scholor - Khan, Z., Govender, M., Indermun, S., Kumar, P., Choonara, Y. E., et al. (2018). In Vitro and In Vivo Evaluation of An Oral Multi-Layered Multi-Disk Tablet for Specialized Chronotherapeutic Drug Delivery. Journal of Drug Delivery Science and Technology, 45:39-44.
Publisher | Google Scholor - Jin, G., Ngo, H. V., Wang, J., Cui, J. H., Cao, Q. R., et al. (2022). Design and Evaluation of In Vivo Bioavailability in Beagle Dogs of Bilayer Tablet Consisting of Immediate Release Nanosuspension and Sustained Release Layers of Rebamipide. International Journal of Pharmaceutics, 619:121718.
Publisher | Google Scholor - Karam, S., Cohen, D. L., Abou Jaoude, P., Dionne, J., Ding, F. L., et al. (2023, July). Approach to Diagnosis and Management of Hypertension: A Comprehensive and Combined Pediatric and Adult Perspective. In Seminars in Nephrology. 43(4):51438.
Publisher | Google Scholor - Akhtar, M., Jamshaid, M., Zaman, M., Mirza, A. Z. (2020). Bilayer Tablets: A Developing Novel Drug Delivery System. Journal of Drug Delivery Science and Technology, 60:102079.
Publisher | Google Scholor - Mazel, V., Tchoreloff, P. (2024). Relaxation Tests for The Time Dependent Behavior of Pharmaceutical Tablets: A Revised Interpretation. International Journal of Pharmaceutics, 665:124728.
Publisher | Google Scholor - Akash Yadav, Kratika Khadsondni, Krutika Mandloi, Tushar Sonare, Aman Kumar, et al. (2024). Exploring The New Horizons in Hypertension Involving the Use of Specialized Tablets. Revista Electronica De Veterinaria, 25(1):2976 -2989.
Publisher | Google Scholor - Advankar, A., Maheshwari, R., Tambe, V., Todke, P., Raval, N., et al. (2019). Specialized Tablets: Ancient History to Modern Developments. In Drug Delivery Systems. 615-664.
Publisher | Google Scholor - Rathore, N., Sahu, N. K. (2024). Design, Development and Evaluation of Bilayer Tablet for Antihypertension Activity. International Journal of Medical Pharmaceutical and Health Sciences, 1-8.
Publisher | Google Scholor - Mourya, H., Garud, N., Joshi, R., Akram, W., Singh, N. (2023). Formulation and Optimization of Propranolol Bilayer Tablets: A Potential Approach for Effective Management of Hypertension. Indian Journal of Pharmaceutical Sciences, 85(2).
Publisher | Google Scholor - Kurćubić, I., Vajić, U. J., Cvijić, S., Crevar-Sakač, M., Bogavac-Stanojević, N., et al. (2021). Mucoadhesive Buccal Tablets with Propranolol Hydrochloride: Formulation Development and In Vivo Performances in Experimental Essential Hypertension. International Journal of Pharmaceutics, 610:121266.
Publisher | Google Scholor - Lunkad, S. H., Sarode, S. (2019). Formulation and Evaluation of Mucoadhesive Tablet of Valsartan. Asian Journal of Pharmaceutical Research, 9(4):229-237.
Publisher | Google Scholor - Mortazavi, S. M., Mortazavi, S. A. (2020). Propranolol Hydrochloride Buccoadhesive Tablet: Development and In-Vitro Evaluation. Iranian Journal of Pharmaceutical Research, 19(2):22.
Publisher | Google Scholor - Abdullah, D., Saeed, R., Ali, M., Sohail, M., Naeem, S., et al. (2024). Formulation and Evaluation of Mucoadhesive Gastro-Retentive Tablets of Domperidone. Journal of Contemporary Pharmacy, 8(2):87-95.
Publisher | Google Scholor - Tak, J. W., Gupta, B., Thapa, R. K., Woo, K. B., Kim, S. Y., et al. (2017). Preparation and Optimization of Immediate Release/Sustained Release Bilayered Tablets of Loxoprofen Using Box-Behnken Design. AAPS PharmSciTech, 18:1125-1134.
Publisher | Google Scholor - Won, D. H., Park, H., Ha, E. S., Kim, H. H., Jang, S. W., et al. (2021). Optimization of Bilayer Tablet Manufacturing Process for Fixed Dose Combination of Sustained Release High-Dose Drug and Immediate Release Low-Dose Drug Based on Quality by Design (QbD). International Journal of Pharmaceutics, 605:120838.
Publisher | Google Scholor - Saadh, M. J., Abosaoda, M. K., Baldaniya, L., Kalia, R., Arya, R., et al. (2024). The Effects of Chia Seed (Salvia hispanica L.) Consumption on Blood Pressure and Body Composition in Adults: A Systematic Review and Meta-analysis of Randomized Controlled Trials. Clinical Therapeutics.
Publisher | Google Scholor - da Silveira Ramos, I. F., Magalhães, L. M., do O Pessoa, C., Ferreira, P. M. P., dos Santos Rizzo, M., et al. (2021). New Properties of Chia Seed Mucilage (Salvia Hispanica L.) and Potential Application in Cosmetic and Pharmaceutical Products. Industrial Crops and Products, 171:113981.
Publisher | Google Scholor - Nerkar, P. P., Mahajan, H., Ige, P., Solanki, R. (2016). Development and Evaluation of Chia Seed Mucilage-Based Buccal Mucoadhesive, Sustained Release Tablet of Venlafaxine. International Journal of Pharmaceutical Sciences and Nanotechnology, 9(6):3536-3543.
Publisher | Google Scholor - Ahmed, S., ur Rehman, H., Ahmed, N. (2024). Potato Starch Extraction: Techniques, Challenges, And Future Opportunities. Journal of Pharmacognosy and Phytochemistry, 13(4):512-524.
Publisher | Google Scholor - Jadhav, A. S., Shewale, A. K., Bhutkar, M. A. (2020). Evaluation of Aloe vera and Hibiscus rosa-sinensis mucilage as a binder in different Tablet Formulations. Asian Journal of Pharmacy and Technology, 10(1):29-37.
Publisher | Google Scholor - Lalwani, P. M., Barhate, S. D., Bari, M. M. (2018). Formulation and Evaluation of Mucoadhesive Tablet of Ondansetron HCl. Asian Journal of Pharmacy and Technology, 8(3):132-138.
Publisher | Google Scholor - Gupta, D., Pandey, M., Maiti, A., Pujari, N. M. (2023). Bilayer Tablet Technology: A Concept of Immediate and Controlled Drug Delivery. Journal of Pharmaceutical Negative Results, 14(1):503-512.
Publisher | Google Scholor - Lunkad, S. H., Sarode, S. (2019). Formulation and Evaluation of Mucoadhesive Tablet of Valsartan. Asian Journal of Pharmaceutical Research, 9(4):229-237.
Publisher | Google Scholor - Maddiboyina, B., Hanumanaik, M., Nakkala, R. K., Jhawat, V., Rawat, P., et al. (2020). Formulation and Evaluation of Gastro-Retentive Floating Bilayer Tablet for The Treatment of Hypertension. Heliyon, 6(11).
Publisher | Google Scholor - Ye, F., Wang, X., Wu, S., Ma, S., Zhang, Y., et al. (2022). Sustained-Release Ivabradine Hemisulfate in Patients with Systolic Heart Failure. Journal of the American College of Cardiology, 80(6):584-594.
Publisher | Google Scholor - Chaurasia, G. (2016). A Review on Pharmaceutical Preformulation Studies in Formulation and Development of New Drug Molecules. Int J Pharm Sci Res, 7(6):2313-2320.
Publisher | Google Scholor - Narang, A. S., Mantri, R. V., Raghavan, K. S. (2017). Excipient Compatibility and Functionality. Developing Solid Oral Dosage Forms. 151-179.
Publisher | Google Scholor - Patel, P. (2019). Preformulation Studies: An Integral Part of Formulation Design. Pharmaceutical Formulation Design-Recent Practices.
Publisher | Google Scholor - Pachori A, Joshi A, Kumar K, Ikram I, Rajput V. (2023). A Comprehensive Review on Sustained Release Tablets. Journal of Integral Sciences. 8-12.
Publisher | Google Scholor - Dogra S, Shah I, Upadhyay U. (2022). The Most Popular Pharmaceutical Dosage Form: Tablet. National Journal of Pharmaceutical Sciences. 2(2):115-121.
Publisher | Google Scholor - Kiran, B., Rao, P. S., Babu, G. R., Kumari, M. V. (2015). Bilayer Tablets-A Review. International Journal of Pharmaceutical, Chemical & Biological Sciences, 5(3).
Publisher | Google Scholor - Kumar G, Verma V. (2024). A Review on Sustained Release Bilayer Tablet. African Journal of Biological Sciences. 6(4):1-4.
Publisher | Google Scholor