
Case Report
Response Of Amaranthus Varieties (Amaranthus Spp.) To Different Seed Rates on Growth, Leaf, And Seed Yields in Jimma, Southwest Ethiopia
1 Agriculural Office, Hanns R.Neumann Stftung Ethiopia (HRNS), Chora Woreda, Bedele, Ethiopia.
2 Jimma University, College of Agriculture and Veterinary Medicine, Jimma, Ethiopia.
3 Mattu University, Bedele Campus, College of Agriculture, Department of Plant Science,Bedele, Ethiopia.
*Corresponding Author: Garome Shifaraw, Mattu University, Bedele Campus, College of Agriculture, Department of Plant Science,Bedele, Ethiopia.
Citation: Deresa T., Nebiyu A., Daba G., Shifaraw G. (2025). Response Of Amaranthus Varieties (Amaranthus Spp.) To Different Seed Rates on Growth, Leaf, And Seed Yields in Jimma, Southwest Ethiopia, Journal of BioMed Research and Reports, BioRes Scientia Publishers. 8(3):1-21. DOI: 10.59657/2837-4681.brs.25.185
Copyright: © 2025 Garome Shifaraw, this is an open-access article distributed under the terms of the Creative Commons Attribution License, which permits unrestricted use, distribution, and reproduction in any medium, provided the original author and source are credited.
Received: June 16, 2025 | Accepted: June 30, 2025 | Published: July 09, 2025
Abstract
The goal of the current study is to find out how varied seed rates in Jimma, Southwest Ethiopia, affect the growth, leaf, and grain production of amaranthus cultivars. The experiment was conducted with supplemental irrigation in 2020–2021. A 2x6 factorial combination with three replications was used in the experiment, which was set up in a fully randomized block design. Madiira II and AC-NL were the cultivars and the seed rate levels. The result showed that, the interaction effect of the variety and the seed rate was highly significant (p<0.01) almost for all traits. The highest number of leaves was harvested from the combined effects of Madiira-II at 2 kg ha-1 (112.33) and AC-NL at 2.5 kg ha-1 (111.66). Madiira II recorded the highest dry matter content was registered from Madiira-II at seed rate of 2.5 kg ha-1 (29.68%); 3 kg ha-1(29.22%) and AC-NL at 4 kg ha-1(27.03%). The highest harvest index was obtained from Madiira-II at 1.5 kg ha-1and lowest from AC-NL at 3 kg ha-1. The leaf yield was highest at a seed rate of 2.5 kg ha-1 for Madiira-II (25.17 t ha-1) with statistical in parity with AC-NL at 2.5 kg ha-1(26.63 t ha-1) and highest at 3 kg ha-1 for AC-NL (30.84 t ha-1). The highest seed yield plant-1 (3.78 g) was produced from 1.5 kg ha-1 and the highest seed yields ha-1 (2.52; 2.64 and 2.68 t) wasobtained from 3; 3.5 and 4 kg ha-1 seed rates. Therefore, it can be concluded that the seed rate in, the two varieties can be tentatively recommended for cultivation in the study area. However, repeating the experiment over seasons and locations is suggested to give a sound and concrete recommendation.
Keywords: ac-nl, madiira-ii; competition; leaf yield; seed yield
Introduction
Amaranthus is a member of the dicotyledonous genus Amaranthus L., which is grown for decorative, grain, leaf, and fodder purposes. It has around 70 species [1, 2]. A. Amaranthus, A. Albersia, and A. Acnida are its three subgenera. The Amaranthus genus is currently widely grown and cultivated in tropical Africa, tropical South America, sections of the Pacific islands, China, India, Indonesia, Japan, and Pakistan [4]. A. dubius, A. lividus, and A. hybridus constitute the majority of vegetal species, whereas A. hypochondriacus, A. cruentus, and A. caudatus are the three primary grain species taken into consideration [5, 6, and 7]. Other than the fact that most farmers and consumers dislike black grains, there is no discernible difference between the sorts of vegetables and grains.
There are few studies on the quantitative and qualitative features that contribute to leaf and grain yield [8]. The yield of amaranthus is contingent upon the production locations and is influenced by multiple factors, including the absence of better cultivars [9]. According to reports, the global average seed yield varies from 1 to 6 t ha-1, while fresh leaf yield varies from 10 to 70 t ha-1 [10]. While the average leaf yield of amaranthus produced worldwide is approximately 14.27 t ha-1, it is lower in African countries such as Nigeria, which is approximately 7.6 t ha-1. The highest yield of amaranth seed reported in Latin America is likely related to the improvement of local varieties through the selection process, and this has not been carried out to the same degree in Africa [11]. When Dmitrieva and Ivanov [13] studied various amaranthus species, they discovered that there were no appreciable differences in the dry matter composition between the species. With the exception of A. spinosus, all amaranthus species demonstrated great biological productivity in their fresh green biomass output. Particularly for long stem species (A. cruentus 53.7 t ha-1 and A. caudatus 49.0 t ha-1), soil and climatic circumstances enabled plants to generate well-developed stems, leaves, and inflorescences that contributed to intense photosynthesis and very high leaf yields.
However, only one species of amaranth (A. cruentus 1.32 t ha-1) showed seed productivity, and in that species, seeds were able to mature to their full potential in every year. In other species, however, seed maturation was not seen because of greater temperature requirements [13]. Three varieties of Amaranthus (white, red, and black) are grown in Ethiopia, according to Mekonnen et al. [14]. It is grown three times a year as a single crop or in conjunction with maize or sorghum, primarily by Menit people (Menitshasa and Menit Goldya) who live in the SNNPR [15]. The SNNPR produces 2,527 ha of amaranth, with the Bench Maji zone accounting for the largest portion, or 689 ha of the total [16]. Inadequate resources (water, light, plant nutrients, and spaces) and fewer or more plant populations are the primary causes of low yields. Resources (water, light, and plant nutrients) are made accessible for plant growth when planting density is relatively low, and competition for these resources is generally minimal. Plant growth tends to decline when planting density increases because of increased competition. As a result, growth is favored by an ideal planting density, meaning that higher than optimal densities inhibit growth [17, 18].
High-yielding cultivars cannot be fully genetically harvested unless an appropriate seeding rate is ensured. Plant density impacts leaf area index and dry matter output through competing for light, nutrients in the soil, and accessible moisture, all of which have an impact on crop growth and production [23–24]. The attainment of enhanced vegetable output and resource efficiency is contingent upon the availability of suitable planting technologies and seed density. High-quality vegetable production would support household income and expand domestic, regional, and global market prospects.
An alternative crop species known as amaranthus has historically been utilized for food, fiber, fodder, oil, or medicinal purposes. Their potential to support food security, nutrition, health, generating revenue, and environmental benefits is underutilized [7]. Due to a number of issues, including the alarming rate of population expansion and the ongoing climate change, the production of Ethiopia's key staple foods is now insufficient to meet the country's food needs [11, 26]. Ethiopia should encourage the production and usage of amaranthus because of its many nutritional advantages [27]. Research, despite its significance, is concentrated on agronomic techniques, particularly seed rates for Ethiopia's significantly lower leaf and grain yields of Amaranthus.
Amaranthus is a widely dispersed wild plant (i.e., weed) in the Jimma area that is utilized for a variety of functions, including personal communication, treating diarrhea, and helping expectant mothers stop bleeding after giving birth. At JUCAVM, Eladale Research Site, Amaranthus variants have been proven since 2015 [25]. Six Amaranthus varieties (UG-AM-13, UG-AM-68, TZSMN102-Sel, AH-NL-Sel, Madiira-I and Madiira-II) were used in the experiment by Bongase et al. [26] with three rows in a row (15, 25, 35 cm); the interrow spacing was 60 cm. It was discovered that Madiira-II produced the highest leaf yield (18.29 t ha-1) and the highest grain yield per hectare (1.802 t ha-1 and 1.786 t ha-1) were produced by TZSMN102-Sel and AH-NL-Sel planted at 15 cm. The best seed rate for a particular variation of the several kinds of amaranthus leaves and grains, however, has not been studied in Ethiopia. Furthermore, there is a lack of easily available information in the literature on Ethiopian agro ecology about the impact of seed rate for a particular variety on the productivity of Amaranthus types in vegetables or grains. Thus, it makes sense to assess numerous Amaranthus cultivars in Jimma, southwest Ethiopia, to examine how they react to varied seed rate levels. The goal of the current study was to ascertain how amaranthus types in Jimma, southwest Ethiopia, responded to varying seed rates in terms of growth, leaf yields, and seed production.
Specific Objectives
To determine the effects of Amaranthus varieties on growth, leaf and seed yields in Jimma, southern Ethiopia
Determine the optimal seed rate that gives the highest leaf and seed yields in Jimma, South West Ethiopia.
To investigate the interaction effects of seed rate and Amaranthus varieties on growth, leaf and seed yields in Jimma, southwest Ethiopia
Materials and Methods
Description of the study area
The study was carried out at the Eladale Research Site of the Jimma University College of Agriculture and Veterinary Medicine (JUCAVM) during 2020/21. The study site is located in Gudeta bula Kebele, in Jimma town, which is located 4 km from Jimma town on the way to Agaro - Bedele. It is located at 1710 m above sea level and at 7 ° 33 'N latitude and 36 ° 57 'E longitude in the Jimma zone, Oromia National Regional State (Figure 1). The mean annual maximum and minimum temperatures are 26.8 and 11.4 ° C, and the mean annual maximum and minimum relative humidity are 91.4 and 39.92%, respectively. The mean annual rainfall in the study area is 1250 mm. The soil of the experimental site is well-drained clay to silt clay with a pH of 5.5. The most common and dominant soil type is Nitisol [28].
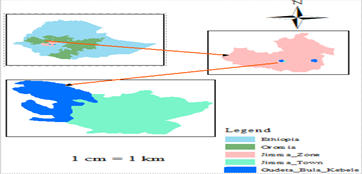
Figure 1: Map of the study area (Gudeta bula rural kebele), Jimma, southern Ethiopia.
Experimental Materials
Two varieties of Amaranthus (Madeira II and AC-NL) were collected from the Melkasa Agricultural Research Center (MARC) and used for the experiment. The two varieties are described as shown below (Table 1).
Table 1: Description of experimental materials based on qualitative characteristics.
| Qualitative characteristics of the Amaranth genotypes. | Genotype | |
| Madiira-II | AC-NL | |
| Branching index | Branches all along the stem | branches all along the stem |
| Branching pattern | Highly branched | Branched |
| Spines in leaf axil | Absent | Absent |
| Leaf margin | Entire | Entire |
| Stem pigmentation | Green | Green |
| Growth habit | Erect | Erect |
| Stem pubescence | Low | Low |
| Prominence of leaf veins | Rogose | Rogose |
| Leaf color | Green | Green |
| Petiole pigmentation | Green | Green |
| Leaf shape | Rhombic | Ovatainate |
| Plant Height | Very tall | Tall |
| Seed color | Black | Brown black |
Treatments and Experimental Design
Treatment consists of two varieties (Madiira II and AC-NL) and six seed rate levels (1.5, 2, 2.5, 3, 3.5, 4 kg ha-1) with 2×6 factor treatment combinations. The experiment was laid out in RCBD with three replications using factorial arrangements. The reference seed rate (standard check) used in this experiment setup was 3 kg ha-1 based on Sokoto and Victor [24].
Experimental Procedures and Crop Management
The area was cleared of undesired weeds, grasses, and plant thrashes. It was then four times plucked by oxen and harrowed by hand until the soil was fine. Each plot included five rows, spaced 60 cm apart, and measured 3 m × 2.7 m (8.1 m2) [26]. Each plot and the replication were separated by 0.6 and 1 meters, respectively. To ensure a uniform stand and speed up the sowing process, the seeds were directly drilled and mixed with well-dry friable soil at a ratio of 1 g seed to 100 g soil [29]. The seeds were planted at a depth of 1.30 cm [30], and to protect them from rain, the soil was lightly covered with well-dried mulching grasses.
Data Collected
Twelve randomly selected plants from the three middle rows of each plot were used to collect data on crop phenology (flowering and maturity), growth and yield, and its constituent parts. To minimize any potential border effect, the two outermost rows were not included in the data collection process.
Data Analysis
Prior to data analysis, each set of data was examined to make sure it complied with the fundamental ANOVA assumptions. The General Linear Model (GLM) of the Statistical Analysis System (SAS) software version 9.3 was utilized to conduct an analysis of variance (ANOVA) on data related to growth parameters, yield, and yield factors [38]. When an ANOVA revealed significant differences, the treatment mean was compared using the least significant difference (LSD) test at a 5% probability level. The relationship between the growth and yield characters was observed using a study of Pearson's correlation coefficient.
The study design model was as follows.

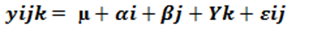
Where Yijk= the mean value of the response variable of the i-th treatment in the j-th variety in the k-th blocks, μ = the overall mean, vi= variety response, srj= seed rate response, (SrV)ij= the interaction effects of seed rate and variety, RK= block (Replication) effect and εijk = random error term.
Results and Discussion
Crop Phenology
Days to 50% flowering
The result indicates that the main effects of the types and the seed rate had a substantial impact on the number of days to 50% blooming (p less than 0.01). On days to 50% blooming, however, the combined impacts of the types and the seed rate were not statistically significant (Appendix Table 1). Figure 2a shows that Madiira II had the longest days to 50% flowering, measuring 72.77 days, whereas the AC-NL variety generated the shortest days, measuring 66.83 days. Variations in the number of days from blossom initiation were ascribed to variations in genotypes. This outcome is in line with the findings of Casini and La Rocca [39], Mbwambo et al. [35], Bongase et al. [26], and Dinssa et al. [40], who said that genotypic changes were the cause of the variances shown in terms of days to 50% blooming.
Furthermore, based on 4 kg ha-1 and 3.5 kg ha-1 seed rates, the findings shown in Figure 2b demonstrated that the first days of 50% blooming were 64.5 and 66.66 days. With 74, 72.16, and 72.16 days, respectively, the 1.5 kg ha-1, 2 kg ha-1, and 2.5 kg ha-1 seed rates had the longest days on record. Three kg of seed per hectare was statistically comparable to two kg, 2.5 kg, and 3.5 kg of seed on fifty percent of the days before flowering. According to this study, a higher seed rate results in a larger plant population, which intensifies interplant competition and prompts early flowering. Variations in the time it takes for flowers to begin can be attributed to the quantity of assimilates that are accessible during the sensitive phase as well as to increased competition for resources among densities of plants, which speeds up blooming time by acting as escape mechanisms for the plant and vice versa. The current investigation aligned with Teshome and Ousman's earlier linseed study [41]. On days of phenological parameters (days of flower initiation), amaranth genotypes respond significantly to varied seed rates, although there was no significant difference for interaction effects.
Days to 50% maturity
The primary influences of the seed rate and variety were shown to have an impact on the physiological maturity from days to 50%. The varieties showed a highly significant difference (p less than 0.01), while the seed rates showed a substantial difference (p less than 0.05). However, the interaction effects of types and seed rates did not impact physiological maturity from days to 50 percentage physiological maturity (Appendix Table 1). The Madiira II variety had the highest recorded number of days to 50 percentage days to maturity (100.94 days), whereas the AC-NL variety had the lowest number of days (90.83 days) (Figure 2a). The genetic diversity in the maturation time across types may be the cause of the variation in days to physiological maturity. This conclusion is consistent with the findings of Dmitrieva and Ivanov [13], who found that amaranthus prefers to grow more rapidly developing species with a growing season of no more than 100 days, and that they require more heat than moisture.
According to Figure 2b, the days to 50% physiological maturity (91.33) recorded from a 4 kg ha-1 seed rate were statistically similar to those recorded from plants sown at 3.5 kg ha-1 (93.66 days), 3 kg ha-1 (95.16 days), and 2.5 kg ha-1 (96 days). On the other hand, 1.5 kg ha-1 seed rates produced the longest days to 50% maturity (100.16 days). The only seed rate that varied from 3.5 kg ha-1 to 4 kg ha-1 was the 1.5 kg ha-1 seed rate; there were no statistically significant changes found in the other seed rates. One possible explanation is that larger plant densities led to more shadowing between plants, which accelerated leaf senescence and resulted in leaf defoliation. The work is not supported by the current study. According to Pandey and Singh [43], there is variance in phenological days because of the crop's unpredictable development pattern and the existence of vegetative structures that persist throughout the reproductive phase [44].
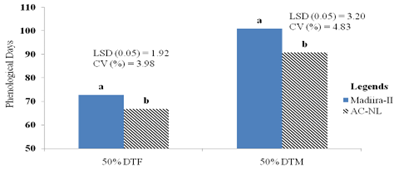
Figure 2a: The effects of Amaranthus varieties on days up to 50% to flowering and 50% to maturity.
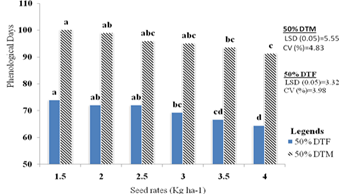
Figure 2b: The main effects of seed rates on days of 50% flowering and 50% maturity.
Growth response
Leaf area plant-1
The primary impacts of variety (p less than 0.01) and seed rate (p less than 0.01) on the leaf area per plant were shown to be highly sensitive (Appendix Table 2). Table 4 displays the largest leaf area (50.08 cm2) measured from the Madiira-II variety and the lowest leaf area (40.03 cm2) from the AC-NL variety. These findings demonstrated that genetic variations in the crop, such as variations in leaf form, influenced the leaf's area. This outcome is consistent with the findings of Liu and Stützel [47], Shankar et al. [46], Srivastava [45], and others, who reported that genotypes accounted for the variation in leaf characters and that the leaf area per plant was affected by this variation.
The findings show that the largest leaf area (56.44 cm2 and 54.05 cm2) was obtained from 1.5 kg ha-1 and 2 kg ha-1, which were statistically equivalent to 50.53 cm2 from 2.5 kg ha-1. The 4 kg ha-1 (33.34 cm2) and 3.5 kg ha-1 seed rate (36.38 cm2) had the lowest leaf area, and they were statistically in parity with the 3 kg ha-1 (39.58 cm2) (Table 4). As the seed rate climbed above 2.5 kg ha-1, the results indicated a small decrease in leaf area. This could be because there were fewer plant densities, which allowed the plant to make the most of its resources (space, nutrients, light, water, air, etc.), resulting in a bigger leaf area due to the low seed rate.The results of the present study were in line with those of Rotich et al. [49], who reported that stress from high planting density decreased leaf size by reducing leaf area expansion and growth, which in turn reduced light interception and photosynthesis. Both results are therefore strongly correlated. Yarnia et al. [48] observed that reduced leaf area with delayed sowing and increased density was due to a shorter growth period and increased competition for agricultural input, especially light, between plants. According to Poorter et al. [50], competition has a significantly bigger effect on the plant's complete leaf area when it comes to nutrient limitation. As a result, a plant with less leaf area may have lower leaves with higher irradiances, which would increase the plant's total leaf mass area. Higher light levels may cause leaves to get thicker rather than the leaf area that can benefit from lighter, according to Weraduwage et al. [51]. Redirecting resources from area growth to thickening enhances the efficiency of creating a new, thicker leaf area and increases the maintenance of respiration loss in the future.
Plant Height
A statistical analysis showed that the major effects of seed rate (p less than 0.01) and variety (p less than 0.01) had a significant impact on plant height.But plant height had no effect on its interaction (Appendix Table 2). The Madiira-II variety produced higher plants (151.19 cm) than the AC-NL variety (121.76 cm), according to the mean value (Table 3). The genetic differences in the crop's growth pattern, including the length and quantity of internodes, the time it takes for flowers to initiate, and physiological maturity, may account for the variation in plant height between the two types. This outcome is consistent with earlier research by Gnan et al. [54], who proposed that an earlier transition to flowering may limit plant size and decrease seed production in the annual plant, and Shahzad et al. [52], who claimed that the genetic composition of a crop, along with environmental factors [53], are the primary controls on crop height. Tejaswini et al. [55] reported that the 27 (27) Amaranthus genotypes showed significant differences in plant height at different stages of growth, of which eight (8) genotypes were found to be Madiira-II. These findings are in strong agreement with the work of Alemu et al. [11], who observed the highest plant height of the genotype (106.77 cm), followed by AC-NL (95.62 cm).
The plant's greatest height (165.03 cm and 152.05 cm) was measured at seed rates of 4 kg ha-1 and 3.5 kg ha-1. These values were statistically similar to the plant's height when sowed at 3 kg ha-1 (144.64 cm). However, the plant heights produced from 1.5 kg ha-1 and 2 kg ha-1 produced the smallest plant heights (109.65 cm and 118.02 cm), which were statistically comparable to the plant height produced from 2.5 kg ha-1 (129.50 cm) seed rate. This could be because, on the one hand, a higher plant density encourages upward growth to compete for light interception, while, on the other hand, a lower plant population gets sufficient resources and more free space for lateral growth, which might limit plant height.
This result is inconsistent with the findings of Henderson et al. [56]; Zubillaga et al. [42], who reported that plant population pressure can limit plant height and also with the experiments of Abbas et al. [57] and Baloch et al. [58] who reported that, increase in seeding rate resulted in a slight decline in the heights of the plants. On the contrary, the present study supports the findings of Olofintoye et al. [59], who observed an increase in plant height with an increase in plant density from 40,000; 50,000 up to 66,666 plants ha−1 in A. cruentus [60]. Similar findings of Suleiman [61] and Alemayehu et al. [11], revealed that an increase in seeding rate resulted in a slight increase in the height of the plants [27].
Number of branches plant -1
Both seed rate and variety had a substantial (p less than 0.01) impact on the number of branches per plant (Appendix Table 2). With 23.61 branches produced plant-1, the Madiira-II cultivar had the highest mean value for the number of branches per plant. Nonetheless, the AC-NL cultivar yielded the fewest branches per plant—20.83—according to Table 3. Genetic variables, such as variations in crop morphology and growth habit, may account for the branch number disparities seen in this study between the two kinds.
The results of this study supported the findings of Mbwambo et al. [35], who noted differences in the RVI00021 and RVI000222 across seasons, and Dinssa et al. [40], who reported that there was only a slight difference in the rankings of the entries that produced a high number of branches between leaf harvest treatments for PARIS (A)-Sel (14.7 in no-leaf harvest and 14.4 in leaf harvest), DB 2006306-Sel (14.0; 13.9), IP-5-Sel (17.9; 14.5), 'Madiira-I’ (18.6; 15.2), and 'Madiira-II’ (19.6; 12.8). Horak and Loughin (2000) discovered that a species' capacity to occupy space is reflected in its branching and plant volume, and they noted that A. palmeri, A. rudis, A. retroflexus, and A. albus were the species ranked highest for these traits. Additionally, according to Garba et al. [62], the varietal trait had a significant impact on the plant's capacity to tiller.
Table 4 shows that the seed rates of 1.5 and 2 kg ha-1 produced the greatest number of branches per plant (24.16 and 24.33), and that these seed rates did not differ from the branches observed from 2.5 kg ha-1 (23.83). At 4 kg ha-1 seed rate, the lowest branch number (19.33) was obtained, while at 3.5 kg ha-1 seed rate, a similar branch number (19.83) was reported. Compared to using 3 kg ha-1, 3.5 kg ha-1, and 4 kg ha-1 seed rates, respectively, using 2 kg ha-1 seed rate produced 10.27%, 18.49%, and 20.54% more branches in this study. In contrast, using 1.5 kg ha-1 and 2.5 kg ha-1 seed rates produced equal branch counts (0.68% and 2.05%).
As a result, it was found that lower plant densities encourage vegetative growth, which includes branches and canopy, and help ensure that plants have access to sufficient nutrients. The opposite might occur from competition for assimilates when resources were depleted sooner and the plant's ability to grow vegetatively was hindered. The current study supports the findings of Caliskan et al. [63] and Chundawat et al. [64], who found that individual plants receive more light and nutrients when there is a greater gap between plants or a lower plant density.
Table 3: Main effects of varieties and seed rates on leaf area, plant height, and branch number in Jimma, southwest Ethiopia, during 2020/21.
| Treatments | Growth Variables | ||
| Seed rate (kg ha-1) | LAPP (cm2) | PH (cm) | NBPP |
| 1.5 | 54.05 a | 109.65 c | 24.16 a |
| 2 | 56.44a | 118.02 c | 24.33a |
| 2.5 | 50.53 ab | 129.50 bc | 23.83ab |
| 3 | 39.58 bc | 144.64 ab | 21.83bc |
| 3.5 | 36.38c | 152.05 a | 19.83cd |
| 4 | 33.34 c | 165.03 a | 19.33 d |
| LSD (0.05) | 11.56 | 21.79 | 2.06 |
| Varieties | |||
| Madiira-II | 50.08 a | 151.19a | 23.61 a |
| AC-NL | 40.03 b | 121.76 b | 20.83b |
| LSD (0.05) | 6.67 | 12.58 | 1.19 |
| CV (%) | 21.43 | 13.33 | 7.77 |
The mean within columns for each variable followed by different letters is significantly different from each other at (p less than 0.01). LAPP = leaf area per plant; PH = plant height; NBPP = number of branches per plant.
Leaf length plant-1
According to the findings, seed rate had a substantial impact on leaf length plant-1 (p less than 0.01). Nevertheless, throughout the experiment's treatments, neither the variety's response nor the combination of variety and seed rate were noted (Appendix Table 2). With 1.5 kg ha-1, the largest leaf length (13.52 cm) was measured; this was comparable to the leaf lengths measured with 2.5 kg ha-1 and 2 kg ha-1 seed rates (13.13 cm and 12.94 cm). At 4 kg ha-1 and 3.5 kg ha-1, the shortest leaf length (10.46 cm and 10.69 cm) was measured with statistical parity with the leaf area recorded from 3 kg ha-1 seed rates (11.39) (Figure 3).
In this experiment, the difference in leaf length was highly determined by seed rates rather than by the genetic makeup of the crops. The result of the present study revealed that the lower seed rate yields the longest leaf length, while the higher seed rate provided the shortest leaf. As shown in Figure 3, as the seed rate increased, the leaf length decreased. his may be due to lower seeding rates, which result in fewer plant populations per unit area, increasing open space and lessening interplant competition for resources. The results of the current study are consistent with those of Bongase et al. [26], who found that longer and wider leaves were encouraged to grow by having more free space within the row. Majumder [65] also found that there were significant differences in leaf length between plants with different spacing, noting that the longest leaves were found with a wider spacing (30 cm x 30 cm) as opposed to a narrow spacing (30 cm x 10 cm) [26].
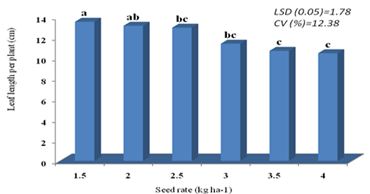
Figure 3: The main effects of seed rate on leaf length per plant (cm).
The mean within columns for each variable followed by different letters is significantly different from each other at (p less than or equal to 0.01).
Number of leaves per plant
The outcome demonstrated that the main effects of the seed rates and the combined effects of the variety and seed rate had a substantial (p less than 0.01) impact on the number of leaves per plant. The quantity of leaves per plant, however, was unaffected by variety (Appendix Table 2). The combination of treatments of the Madiira-II variety with 2 kg ha-1 and AC-NL variety at 2.5 kg ha-1 produced the maximum number of leaves per plant (112.33 and 111.66), which were statistically similar to the number of leaves found from the Madiira-II variety at 2.5 kg ha-1 and AC-NL variety with 3 kg ha-1 seed rate (108.33 and 104). Plots treated with AC-NL at 1.5 kg ha-1 produced 88 leaves per plant, which did not differ from the Madiira-II variety with 3.5 kg ha-1 (94.33); AC-NL 2 kg ha-1 (94.66); AC-NL 3 kg ha-1 (104); Madiira-II at 1.5 kg ha-1 (81.33); Madiira-II at 4 kg ha-1 (81) and AC-NL at 4 kg ha-1 (77.33 leaves). The combined effects of the AC-NL variety with 3.5 kg ha-1 produced the lowest leaf number (62) and did not differ statistically from Madiira-II at 3 kg ha-1 (66.66) and AC-NL at 4 kg ha-1 (77.33 leaves) (Table 4).
A lower plant population that produces higher branches with a larger leaf area may result in fewer leaves per plant and a shorter phonological time. Table 4 demonstrated that the combined effect of the two amaranthus varieties with lower seed rates and higher seed rates produced similar results. Conversely, a higher seed rate results in leaf defoliation because of shadowing effects that decrease assimilate production and the photosynthetically active surface area of leaves for solar radiation, particularly around the flowering phase [66, 67].
It was discovered that the amaranthus variety with the ideal seed rate had more leaves per plant than the variety with a lower or higher seed rate (Table 5). The current result was consistent with the research of Henderson et al. (2000), who noted that plant density in amaranthus could influence the number of leaves per plant; Tejaswini et al. [55] and Sokoto and Victor [24], who clarified that planting technique and seed rates had an impact on amaranthus (Amaranthus spp.) leaves.
Leaf width
The results of this investigation demonstrated that the primary effects of seed rates, varieties, and their interactions had a significant impact on leaf width (p less than 0.01) (Appendix Table 2). Table 4 illustrates that the Madiira-II variety's combined impacts with a 2 kg ha-1 seed rate produced the broadest leaf width (3.30 cm), which differed significantly from the other seed rates. The combination of the AC-NL variety with 1.5 kg ha-1; AC-NL3 kg ha-1; AC-NL 2 kg ha-1 and Madiira-II 1.5 kg ha-1 seed rates yielded the following larger leaf widths (2.97 cm; 2.96 cm; 2.95 cm and 2.94 cm), which were statistically equivalent. Nonetheless, AC-NL 3.5 kg ha-1 and AC-NL 4 kg ha-1 had the smallest leaf widths, measuring 2.39 cm.
This study's results are similar to those of Bongase et al. [26], who reported that the Madiira II variety had wider (9.749 cm) leaves with a wider intrarow spacing of 35 cm, while the variety UG-AM-13 planted at an intrarow spacing of 15 cm had the shortest (5.67 cm) and narrowest (4.91 cm) leaves. The variation in leaf width among treatments could be due to the combined effects of the crop's genetic makeup on growth habits, leaf shapes, and leaf structures as well as the interaction of the variety with the environment and agronomic practices.
Stem diameter
The results of this investigation demonstrated that the diameter of the shoot was influenced by seed rates (p less than 0.01), variety main effects (p less than 0.05), and combination effects (p less than 0.01) of both variety and seed rate (Appendix Table 2). The Madiira-II variety treated with 1.5 kg ha-1 had the widest stem diameter (2.39 cm), while the Madiira-II variety treated with 2 kg ha-1 produced a statistically similar stem diameter (2.10 cm). Table 4 shows that the Madiira-II variety had the narrowest stem diameter, measuring 4 kg ha-1 (1.23 cm), followed by Madiira-II 3.5 kg ha-1 (1.30 cm), AC-NL 4 kg ha-1 (1.32 cm), Madiira-II 3 kg ha-1 (1.38 cm), and AC-NL 3.5 kg ha-1 (1.40 cm). The AC-NL variety had the narrowest stem diameter, measuring 3 kg ha-1 (1.49 cm).
The genetic makeup of crop morphology, including root morphology, root length, and the capacity to use and absorb nutrients in the soil and interact with the environment, as well as agronomic practices, were found to contribute to a trend of differences in stem diameter. For the two amaranth species, the rise in seed rate led to a notable drop in stem diameter and an increase in stem density. This is because increased seed rates naturally lead to increased stem densities, which in turn cause stem diameters to shrink as a result of clear plant competition [68]. Thin stemmed plants with a propensity to lodge are produced by higher plant densities [68, 69, 70]. his result confirms the findings of Gimplinger et al. [9] who studied two amaranth genotypes over a two-year period and found that there was a significant decrease in plant height, stem diameter, and branch number with increasing density. In a related study, Igbokwe and Hollins [71] studied vegetable amaranthus (Amaranthus cruentus L.) and found that the highest stem diameter (4.6 cm) was obtained from the plant spacing 0.9 m, and the lowest stem diameter (2.6 cm) from the plant spacing 0.3 m. Similarly, Gondal et al. [68] and Snider et al. [72] reported similar findings, suggesting that plant stand establishment may be more favorable under narrow row spacing than wider row spacing, i.e. 76 cm row spacing.
Fresh biomass above ground
According to statistical analysis, seed rates, variety, and the interaction between variety and seed rate all had a significant impact on the fresh above-ground biomass plant-1 (p less than 0.01) (Appendix Table 2). According to Table 4's data, the Madiira-II variety's combined effects with a 2 kg ha-1 seed rate produced a maximum TAGFBP (195.66 g) that was much larger than the other variety. Plots treated with AC-NL 1.5 kg ha-1 and AC-NL 3 kg ha-1 produced fresh biomass above ground per plant yields that were comparable, at 150.58g and 145.66g, respectively. Madiira-II 3.5 kg ha-1 and Madiira-II 1.5 kg ha-1, as well as the amaranthus variety Madiira-II 1.5 kg ha-1, were statistically similar to treatment with AC-NL variety at 2 kg ha-1 seed rate. According to statistical analysis, seed rates, variety, and the interaction between variety and seed rate all had a significant impact on the fresh above-ground biomass plant-1 (p less than 0.01) (Appendix Table 2). According to Table 4's data, the Madiira-II variety's combined effects with a 2 kg ha-1 seed rate produced a maximum TAGFBP (195.66 g) that was much larger than the other variety. Plots treated with AC-NL 1.5 kg ha-1 and AC-NL 3 kg ha-1 produced fresh biomass above ground per plant yields that were comparable, at 150.58g and 145.66g, respectively. Madiira-II 3.5 kg ha-1 and Madiira-II 1.5 kg ha-1, as well as the amaranthus variety Madiira-II 1.5 kg ha-1, were statistically similar to treatment with AC-NL variety at 2 kg ha-1 seed rate.
According to Patel et al. [73], total fresh weight (242.67 g plant-1) and total dry matter accumulation (67.50 g plant-1) were found to be influenced by the interaction between 45 cm row spacing and G2-GA-1 genotypes with 2.5 kg ha-1 seed rate. These results are consistent with the current findings. According to similar findings, Bongase et al. [26] discovered that the fresh above-ground biomass per Madiira II plant planted at 47,619 plants ha-1, AH-NL-Sel planted at 47,619 plants ha-1 and 66,666 plants ha-1, and Madiira-I planted at 111,111 plants ha-1 plant density, were 812.20 g, 719.30 g, 669.60 g, and 666 g, respectively.
Dry biomass above ground
Due to the variety's primary effects, seed rate, and interaction effects (p less than 0.01), the results for the dry biomass above ground plant-1 were very significant (Appendix Table 2). The combination of the Madiira-II variety with 2.5 kg ha-1, the Madiira-II variety with 2 kg ha-1, and the AC-NL variety with 3 kg ha-1 yielded the greatest AGDBP (32.9 g; 32 g and 31 g). Similar results were obtained with Madiira-II 3.5 kg ha-1, Madiira-II 1.5 kg ha-1, Madiira-II 3 kg ha-1, and AC-NL 2.5 kg ha-1 in the plot treated with AC-NL 1.5 kg ha-1. In comparison to AC-NL 3.5, the combined effects of the AC-NL variety with 4 kg ha-1 produced the lowest dry biomass above ground plant-1 (18.33 g).
This result is consistent with the findings of Pourfarid et al. [74], who showed that increasing the density of plants per square meter increased the dry weight of the above ground of the plants per square meter but with decreasing dry biomass plant-1 as a result of stem becoming thinner [26]. Yarnia et al. [48] reported that reduction of organ dry matter was significantly reduced plant-1 at high crop density due to the probable reduction in biomass components as a result of reduction of the net accumulation of assimilate in plant leaves, plant height, and number of lateral branches.According to Zubillaga et al. [42], there is a clear correlation between the number of plants at harvest and the amount of biological yield.
Dry matter content
Analysis of variance showed that dry matter plant-1 was significantly responsive to varieties ((p less than 0.01); seed rates and interaction effects of variety and seed rate (p<0> (Appendix Table 2). With respect to the combined effects of the AC-NL variety with 3.5 kg ha-1 (25.81 %) and the Madiira II variety treatment combination of Madiira-II variety with 2.5 kg ha-1; Madiira-II 3 kg ha-1; and AC-NL 4 kg ha-1 seed rate, the results displayed in Table 4 showed that the combination performed best in terms of dry matter yield, with percentages of 29.68%, 29.22%, and 27.037% per plant with statistical parity. Table 4 shows that Madiira-II 2 kg ha-1, AC-NL 1.5 kg ha-1, and AC-NL 2 kg ha-1 produced the lowest DMC per plant (16.39 %, 16.69 %, and 17.09 %). Similar statistical results were reported from AC-NL 2.5 kg ha-1 and Madiira-II 4 kg ha-1 (17.96 % and 20.04%). This research further shown that DMC is dependent on the crop's ability to utilize resources (light, nutrients, etc.) effectively at the maximum plant density; it is also associated with crop phenology and growth and yield components.
According to Wilson et al. [75], leaf thickness is not as significant a correlate of resource acquisition, consumption, and availability as leaf composition variation is. This is because dry matter content is superior than leaf thickness. According to Baturaygil et al. [76], variation in flowering time is primarily responsible for the differences in dry matter content and plant height between the genotypes of the 10 biomass type genotypes and the grain production variety used as a check (Bärnkrafft). This is because early flowering results in a longer seed ripening phase and improved dry matter content, whereas late flowering due to short-day genes leads to longer vegetative growth and higher plant height. On the days of flowering time, the results of Baturaygil et al. [76] did not, however, align with the current findings. Consequently, Madiira II was found to be a late flowering variety in the current study, taking 72.77 days to flower and having a higher dry matter content than AC-NL, which flowers 66.83 days after seeding.
Table 4: The influences of the interaction effects of amaranth varieties on seed rate on growth parameters in Jimma, South-West Ethiopia, during 2020/21.
| Treatments | Growth Parameter | ||||||
| Varieties | Seed rate (kg ha-1) | NLPP (cm) | LW (cm) | SD (cm) | AGFBP (g) | AGDBP (g) | DMC (%) |
| Madiira 2 | 1.5 | 81.33 def | 2.94 b | 2.39 a | 116.66de | 26.6 bc | 22.94bc |
| 2 | 112.33a | 3.30 a | 2.10ab | 195.66 a | 32 a | 16.39 e | |
| 2.5 | 108.33ab | 2.80d | 2.07b | 111.00 e | 32.9 a | 29.68 a | |
| 3 | 66.66 fg | 2.54 f | 1.37f | 84.08 f | 24.43c | 29.22 a | |
| 3.5 | 94.33bcd | 2.86 c | 1.30f | 129.33c | 27.73b | 21.58cd | |
| 4 | 81.00 def | 2.55 ef | 1.23f | 106.00 e | 21.23 de | 20.04cde | |
| AC-NL | 1.5 | 88.00 cde | 2.97b | 1.90bc | 150.58 b | 25.16bc | 16.69 e |
| 2 | 94.66 bcd | 2.95 b | 1.75cd | 124.33cd | 21.23de | 17.09 e | |
| 2.5 | 111.66 a | 2.59 e | 1.69cde | 132.66c | 23.83cd | 17.96de | |
| 3 | 104.00abc | 2.96 b | 1.49def | 145.66 b | 31.00a | 21.31cd | |
| 3.5 | 62.00 g | 2.39 e | 1.40ef | 79.00 fg | 20.16ef | 25.81ab | |
| 4 | 77.333efg | 2.35 g | 1.32 f | 67.83 g | 18.33f | 27.03a | |
| LSD (0.05) | 16.44 | 0.04 | 0.29 | 11.70 | 2.84 | 3.99 | |
| CV (%) | 10.77 | 1.02 | 10.36 | 5.74 | 6.60 | 10.66 | |
The mean within columns for each variable followed by different letters is significantly different from each other at (p less than or equal to 0.01). NLPP = number of leaves per plant; LW = leaf width; SD = Stem Diameter; TAGFBP = total aboveground fresh biomass per plant; TAGDBP = total aboveground dry biomass per plant and DMC = dry matter content.
Yield and Yield-related response
Fresh leaf yield per plant
The current findings show that the fresh leaf yield per plant was significantly impacted by the varieties (p less than 0.01), seed rates (p less than 0.01), and the interactions between the amaranth varieties and the seed rate (p less than 0.01) (Appendix Table 3). The highest fresh leaf yield per plant (42.25 g plant-1) was observed from plots allocated with the AC-NL variety at 1.5 kg ha-1, which was statistically similar to the fresh leaf yield harvested from AC-NL at 2 kg ha-1 (40.66 g); AC-NL at 2.5 kg ha-1 (40.66 g); and Madiira-II at 2.5 kg ha-1 seed rate (38.66 g). The lowest fresh leaf yield per plant (12.66 g) was harvested from Madiira-II with 4 kg ha-1 with statistical on parity with AC-NL 4 kg ha-1 seed..This study shown that when amaranth types were handled at reduced seed rates, the leaf output per plant rose. Enough room and reduced competition for nutrients and other resources (light, water, etc.) may be the cause of this. The current study is comparable to that of Bongase et al. [26], who found that planting amaranth cultivars with the widest intrarow spacing (35 cm) and the narrowest intrarow spacing (15 cm) boosted leaf output per plant.
Fresh leaf yield ha-1
As demonstrated by Appendix Table 3, the fresh leaf yield production per plant and per hectare was found to be strongly impacted by seed rates (p less than 0.01), varieties (p less than 0.01), and the interaction between the seed rate and amaranthus varieties (p less than 0.01). The highest fresh leaf yield (30.84 t ha-1) was obtained by the combined effects of the AC-NL variety with 3 kg ha-1 over all other treatments. With respect to yields collected from plots treated with AC-NL at 2 kg ha-1 (23.54 t ha-1), the next-best yields (26.63 and 25.17 t ha-1) were from Madiira-II at 2.5 kg ha-1 and AC-NL at 2.5 kg ha-1. These yields presented statistical parity. 14.35, 14.62, and 14.76 t/ha were the lowest fresh leaf yields.
According to the results of this investigation, using the AC-NL variety at 3 kg ha-1 resulted in 7.30 tons greater leaf yield than using the AC-NL variety at 2 kg ha-1; 4.47 tons more leaf yield than using the AC-NL variety at 2.5 kg ha-1; and 12.00 tons more leaf yield than using the AC-NL variety at 3.5 kg ha-1. In a similar vein, using 2.5 kg ha-1 of Madiira-II yielded 4.38 tons more fresh leaf yield than using 2 kg ha-1 of Madiira-II, and 3.04 tons more than using 3 kg ha-1 of Madiira-II. A higher degree of correlation between growth and yield parameters, agronomic techniques, environmental conditions, and genetic differences could all be contributing to the production differential mentioned above (Table 5).
According to Patel et al. [73], when 45 cm row spacing, GA-1 genotypes, and 2.5 kg ha-1 seed rate are combined, the interaction for green forage yield (43.53 t ha-1) and dry matter yield (3.01 t ha-1) is significantly greater.
Table 5: The effects of the interaction of amaranth varieties with seed rate on fresh leaf yield per plant and per hectare in Jimma, South West Ethiopia, during 2020/21
| Treatments | Yield and yield related variables | ||
| Varieties | Seed rate (Kg ha-1) | FLY PP | FLY PH |
| Madiira 2 | 1.5 | 32.00 d | 14.35 f |
| 2 | 37.33 bc | 20.78 de | |
| 2.5 | 38.66 abc | 25.17 bc | |
| 3 | 24.41 e | 22.13 cde | |
| 3.5 | 20.00 ef | 20.86 de | |
| 4 | 12.66 h | 14.62 f | |
| AC-NL | 1.5 | 42.25 a | 20.66 de |
| 2 | 40.66 ab | 23.54 bcd | |
| 2.5 | 40.66 ab | 26.63 b | |
| 3 | 34.00 cd | 30.84 a | |
| 3.5 | 18.00 fg | 18.84 e | |
| 4 | 13.33 gh | 14.76 f | |
| LSD (0.05) | 4.82 | 3.61 | |
| CV (%) | 9.65 | 10.10 | |
The mean within columns for each variable followed by different letters is significantly different from each other at (p less than 0.01). FLYPP = fresh leaf yield per plant; FLY PH = fresh leaf yield per hectare.
Number of inflorescences plant-1
According to the statistical outcome, variety (p less than 0.01) and seed rate (p less than 0.01) were the two primary influences that had the greatest impact on the number of inflorescences (Appendix Table 3). (19.14) inflorescences per plant was the most for the AC-NL variety. But the Madiira II variety had the lowest score (16.34). The capacity to effectively utilize available resources and genetic variance in flower form may be the cause of this. Gnan et al.'s research [54] showed that larger inflorescences were better preserved by the admission of higher effective photosynthetic rates. This study corroborates the findings of Varalakshmi [77], who reported that the inflorescence's density varied widely, ranging from low to dense and intermediate, and Panda et al. [43].
A 1.5 kg ha-1 seed rate yielded the greatest number of inflorescences per plant (23.93), which was statistically equivalent to the number of inflorescences obtained from 2 kg ha-1 seed rates (21.15). The inflorescence recorded from 3.5 kg ha-1 seed rate (14.56) was statistically equivalent to the inflorescence scored from a seed rate of 4 kg ha-1, which resulted in the lowest number of inflorescences per plant (12.12). According to this result, 1.5 kg ha-1 and 2 kg ha-1 produced inflorescences per plant that were comparable, with 2.5 kg ha-1 seed rate coming in second (Table 5). The explanation may have to do with increased open area, optimal light interception at a lower or lower seed rate, and, conversely, decreased resources as a result of shadowing.
There is a positive correlation between vegetative size and reproductive output, indicating a trade-off between time to reproduction and reproductive output. Gnan et al. [54] nevertheless proposed that leaves are the main source of carbon for reproduction in plants. The study found that there was a significant positive correlation between the number of inflorescences per plant and 50 percentage days of flowering, dry above ground biomass per plant, and harvest index. Conversely, there was a significant negative correlation between the number of inflorescences per plant and growth parameters like stem diameter, branch number, fresh leaf yield per hectare, inflorescence length, seed yield per hectare, and thousand seed weight compared to leaves.
Seed yield plant-1 and ha-1
The primary effects of variety and seed rate were substantially linked (p less than 0.01) with the seed yield per plant and per hectare (Appendix Table 3). The Madiira II variety produced a larger seed yield (3.38 g plant-1 and 2.53 t ha-1) than the other variety. This difference in seed yield was substantial. The minimum seed yield per plant was 2.69 g plant-1 and the minimum seed yield per hectare was 2.04 t ha-1, respectively, produced by the AC-NL variety. The variation in the period for flower initiation and physiological maturity, the number and length of inflorescences, and the transport of nutrients and photosynthetic energy from seed to other vegetative components like leaves could all be contributing factors to the variation in seed output.
The seed yield of the amaranth varieties was also significantly influenced by the seed rate; the plant-per-seed yield (3.78 g) was highest at 1.5 kg ha-1, which was statistically similar to 2 kg ha-1 (3.49 g) and 2.5 kg ha-1 (3.27 g plant-1). But the 4 kg ha-1 (2.35) seed rate gave the lowest seed production per plant, matching the 3.5 kg ha-1 seed rate (2.54) (Table 6).
The highest seed yields per hectare were obtained from 4 kg ha-1, 3.5 kg ha-1, and 3 kg ha-1, yielding 2.68 t ha-1, 2.64 t ha-1, and 2.52 t ha-1 of seed. The 1.5 kg ha-1 seed rate yielded the lowest seed yield per hectare (1.78 t ha-1) and was identical to the 2 kg ha-1 seed rate (Table 6). The current study discovered that a low seed rate produced the maximum seed output per plant. Higher seed rates did, however, result in the greatest seed yield per hectare. This might be caused by agronomic techniques (seed rate), the area that enhances light interception to increase plant photosynthetic capacity, and the correlation between grain properties.
The current study confirms the findings of Khan et al. [78], who found that plants grown with wider spacing performed better individually and had more land available to them for photosynthesis and more solar radiation to absorb. In terms of seed yield per unit area, the yield is influenced by factors such as the total number of plants per unit area and yield contributing parameters in addition to the performance of each individual plant.
. According to Apaza-Gutierrez et al. [79], grain yield increased linearly within the density range, stem diameter and grain yield per plant decreased quadratically with increasing plant density, and grain yield per unit area may be directly correlated with the plant's capacity to store nutrients on the stem. Similar results were obtained by Bongase et al. [26], who found that low plant density causes plants to generate more branches and leaves per plant, which in turn causes the creation of more inflorescences, each of which contains more seeds.
Table 6: Influences of the main effects of seed rate and varieties on the number of inflorescences per plant, the seed yield per plant and per hectare in Jimma, South-West, Ethiopia, during 2020/21.
| Treatments | Yield and Yield-related variables | ||
| Seed rate (Kg/ha) | NIPP | SYPP (g plant-1) | SYPH (t ha-1) |
| 1.5 | 23.93 a | 3.78a | 1.78 c |
| 2 | 21.15 ab | 3.49 ab | 1.98 bc |
| 2.5 | 19.25 b | 3.27b | 2.13 b |
| 3 | 15.44 c | 2.79 c | 2.52 a |
| 3.5 | 14.56 cd | 2.54cd | 2.64 a |
| 4 | 12.12d | 2.35d | 2.68 a |
| LSD (0.05) | 3.16 | 0.29 | 0.29 |
| Varieties | |||
| Madiira-II | 16.34 b | 3.38 a | 2.53a |
| AC-NL | 19.14 a | 2.69b | 2.04b |
| LSD (0.05) | 1.82 | 0.16 | 0.17 |
| CV (%) | 14.90 | 7.97 | 10.85 |
The mean within columns for each variable followed by different letters is significantly different from each other at (p less than 0.01). NIPP = number of inflorescences per plant; SYPP and SYPH= seed yield per plant and per hectare.
The inflorescence height was analyzed and the results showed that the inflorescence height was significantly affected by the main effects of the variety and seed rates (p less than 0.01) as well as by the combined effects of the variety and seed rate (p less than0.01) (Appendix Table 3). The longest inflorescence height (25.66 cm) was produced by the combination of the Madiira-II variety and 2.5 kg ha-1 seed rate, which was significantly longer than the others. The next longest inflorescence height (24.41 cm) was recorded from the Madiira-II variety with 2 kg ha-1, which produced a similar inflorescence length (23.83 cm), followed by the longest inflorescence (19.83 cm) from AC-NL with 4 kg ha-1 seed rate (Table 7). The genetic variations in growth habit, flower morphology, biological time for flower initiation, competition between vegetative and reproductive phases at critical times, and genotype's ability to interact with the environment and agronomic management practices could all be contributing factors to the variation in inflorescence height among treatments.
The decrease in inflorescence height seen in Madiira II and AC-NL Amaranthus species at higher seed rates (over 2.5 kg ha-1) may be attributed to resource limitation brought on by intense competition during critical phases of the parts' vegetative and reproductive growth. The other possible explanation is that in this study, treatments assigned with a lower seed rate (≤ 2.5 kg ha-1) for both varieties recorded the highest growth parameters, including the maximum number of branches, the length of the leaf, and the thickest stem diameter. In addition, inflorescence height was strongly and positively associated with all parameters except the dry weight of the leaf, the dry matter, and the height of the plant (Table 7).
The current discovery aligns with the findings of Roitner-Schobesberger and Kaul [80], who demonstrated that amaranthus source strength during blooming was a greater yield-limiting factor than sink capacity.
Harvest index
Data analysis revealed that seed rates had a substantial impact on the harvest index (p less than 0.01), as did the interaction between the seed rate and the amaranth variety (p less than 0.01) (Appendix Table 3). With 1.5 kg ha-1, the Madiira-II variety had the highest percentage of the harvest index (16.23) of any Madiira variety, matching the AC-NL 2 kg ha-1 seed rate (14.62%). At 3 kg ha-1 seed rate, AC-NL produced the lowest percentage (8.05) of the harvest index, suggesting that photoassimilate partition migrated into other biological yields, such as leaves, rather than reproductive portions.
Based on this outcome, the harvest index typically ranged from 8.05 to 16.23% (Table 8). The genetic differences between varieties in how resources are distributed to seeds as opposed to leaves, competition between different parts of the vegetative and reproductive phases, and possible interactions between the genotype and the environment and management techniques could all contribute to the variation in the harvest index among treatments.
The current result is consistent with earlier research by Guillen-Portal et al. [81], who also reported that grain yields over a wide range of plant populations varying from 4 to 200 plants m−2 at a row spacing of 0.76 m. Gimplinger et al. [9] reported that increasing density reduced the harvest index and low plant density allowed the potential for yield to be exhausted.
Comparable studies by Bongase et al. [26] showed that for Madiira II, which was arranged from low plant density (47,619 plants ha-1) to high plant density (111,111 plants ha-1), a harvest index of 5.71% to 7.28% was attained, while the harvest index varied between amaranth genotypes from 5.71% to 37.48 %. The plant's capacity to devote more biomass (assimilates) to leaves and biological yields than to reproductive portions is indicated by the low harvest index [82].
Thousand seed weight
The outcome showed that the main effects of the varieties, seed rates, and the interaction between the amaranth variety and seed rate (p<0>
This data made it possible to deduce that amaranthus reacts at a reduced seed rate to thousands of seed weight. This may be the result of shade and branch overlapping effects among growth characteristics, or it may be the result of leaf defoliation at larger plant densities. Seed weight, plant-1 seed quantity, and yield components may have been impacted by this event. This study is consistent with previous research showing that diminished sources as a result of defoliation or shade lowered seed bulk and yield [80, 83].
Table 7: The Effects of the Interaction of Seed Rate and Varieties on Yield and Yield-Related Variables of Amaranth in Jimma, Southwest, Ethiopia during 2020/21
| Treatments | Yield and yield related variables | |||
| Varieties | Seed rate (kg/ha) | IL (cm) | HI (%) | TSW (g) |
| Madiira 2 | 1.5 | 23.83 bc | 16.23 a | 0.81 a |
| 2 | 24.41 b | 12.13 cd | 0.83 a | |
| 2.5 | 25.66 a | 11.13 cd | 0.78 b | |
| 3 | 23.33 c | 12.65 bc | 0.55 d | |
| 3.5 | 21.16 d | 10.22 d | 0.4 f | |
| 4 | 21.76 d | 12.08 cd | 0.4 f | |
| AC-NL | 1.5 | 23.43 c | 13.06 bc | 0.78 b |
| 2 | 23.43 c | 14.62 ab | 0.76 b | |
| 2.5 | 23 c | 12.15 cd | 0.65 c | |
| 3 | 22 d | 8.05 e | 0.5 e | |
| 3.5 | 21.33 d | 11.39 cd | 0.4 f | |
| 4 | 19.83 e | 11.75 cd | 0.4 f | |
| LSD (0.05) | 0.951 | 2.13 | 0.03 | |
| CV (%) | 2.46 | 10.39 | 3.17 | |
The mean within columns for each variable followed by different letters is significantly different from each other at (p less than 0.01). IL=inflorescence length; HI = harvest index and TSW= thousand seed weight.
Correlation analysis
Fresh leaf yield ha-1 was found to be positively and significantly (p less than 0.01) correlated with days to 50% maturity (r=0.47**), leaf area (r=0.57**), leaf length (r=0.47**), leaf width (r=0.53**), stem diameter (r=0.65**), number of branches (r=0.60**), leaf yield plant-1 (r=0.54), above-ground fresh biomass (r=0.59**), leaf weight (r=0.65**), dry matter content (r=0.47**), inflorescence length (r=0.74**), seed yield plant-1 (r=0.72**); seed yield ha-1 (r=0.55**).
On the other hand, it was significantly and adversely correlated with the following: plant height (r= 0.44**), inflorescence number (r= 0.65**), harvest index (r= 0.73**), days to 50% blooming (r= -0.85**). LFYPH (t ha-1) did not, however, show any correlation with TSW, TAGDBPP, or NLPP. The leaf yield ha-1 may be dependent on the number of plants per unit of area rather than on individual plants, which could be the cause (Table 8).
This study is consistent with that of Bongase et al. [26], who found a positive and significant correlation between leaf yields ha-1, plant-1 branch count, leaf yield plant-1, leaf area, leaf area index, and the dry weight of biological yield plant-1.
The seed yield ha-1 also showed a significant (p≤0.01; p≤0.05) positive correlation with the following: days to 50% maturity (r=0.79**); leaf number (r=0.59**); leaf area (r=0.31*); leaf length (r=0.68**); leaf width (r=0.58**); stem diameter (r=0.65**); branch number (r=0.72**); leaf fresh yield plant-1 (r=0.68**); leaf yield ha-1 (r=0.55**); leaf dry weight (r=0.49**); dry matter content (r=0.54**); inflorescence length (r=0.48**); seed yield per plant (r=0.76**); and thousand seed weight (r=0.59**).Nonetheless, Table 9 shows that it had a substantial negative correlation (p≤0.01; p≤0.05) with days to 50% blooming (r= -0.77**), above ground biomass (r= -0.36*), and number of inflorescences plant-1 (r= -0.35*). These findings showed that the quantity of inflorescences, dry biomass, and phonological time for flower initiation all significantly impacted seed yields.
Table 8: Pearson's correlation coefficient analysis for growth, leaf and seed yield of Amaranthus varieties (Amaranthus var.).
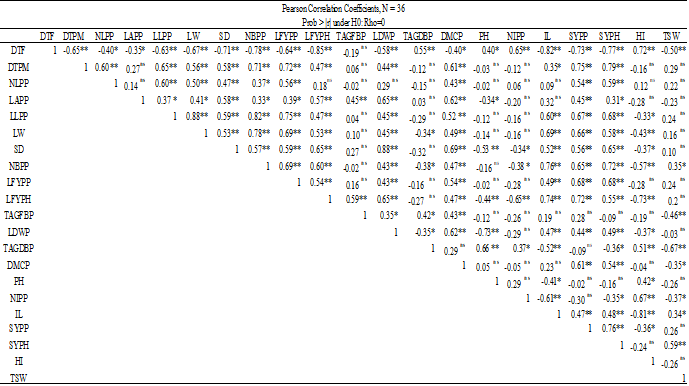
* = Significant at 5 %; ** = Significant at 1 %; DTF = 50 percentage days to Flowering; DTPM = 50 percentage days to physiological maturity; NLPP = number of leaves per plant; LAPP = leaf area per plant; LW = leaf width; SD = stem Diameter; NBPP = no branches per plant; LFYPH = fresh leaf yield per hectare; TAGFBP = total above ground fresh biomass per plant; LDWP = dry leaf weight per plant; TAGDBP = total above ground dry biomass per plant; DMC = dry matter content; PH = plant height; NIPP= number of inflorescence per plant; IL = Inflorescence Length; SYPH = seed yield per hectare; HI = Harvest Index; TSW = thousand seed weight
Summary and Conclusion
Amaranthus is one of the indigenous and neglected vegetable crops grown and widely distributed in many parts of Ethiopia. raditionally utilized as feed, edibles, and therapeutic plants during famines and food shortages, particularly in low-income homes. However, because of poor agronomic methods, such as using the right seed rates, and a lack of better variety, its productivity and production are considerably below its yield potential. Therefore, supplemental irrigation was used to conduct this study in 2020–2021.
The study employed a complete randomized block design (RCBD) with three replications, utilizing a 2x6 factorial combination to investigate the effects of six different seed rate levels (1.5, 2, 2.5, 3, 3.5, and 4 kg ha-1) on the growth, leaf, and seed yields of two Amaranthus varieties, Madiira-II and AC-NL, in Jimma, southwest Ethiopia.
The results of this study showed that seed rate, variety main effects, and their interaction effects all had an impact on growth, leaf, and seed yields. The primary effects of the amaranthus types and seed rates on the number of days to 50% flowering, days to 50% maturity, leaf area, plant height, number of branches, number of inflorescences, and seed production per plant and per hectare resulted in significant differences (p<0>
In general, the Madiira-II variety outperformed the AC-NL variety in terms of seed yield per plant (3.38 g) and per hectare (2.53 t) according to the current findings. Nonetheless, the AC-NL variety's primary impacts generated the greatest number of inflorescences per plant (19.14).
. With respect to the primary impacts of seed rates, the highest seed yield per hectare (2.52; 2.64 and 2.68 t) was obtained from 3; 3.5 and 4 kg ha-1 seed rates, whereas the maximum seed yield per plant (3.78g) was produced from 1.5 kg ha-1 seed rates. In contrast, Madiira-II with 2.5 kg ha-1 seed rates and AC-NL with 2.5 kg ha-1 seed rates produced statistically identical fresh leaf yields per hectare (26.63 and 25.17 t), respectively. AC-NL discovered that the maximum fresh leaf yield per hectare came from AC-NL with 3 kg ha-1 seed rates (30.84 t). Nonetheless, Madiira-II at 1.5 kg ha-1 (14.35 t) and Madiira-II at 4 kg ha-1 seed rates (14.62 t) yielded the lowest fresh leaf yield per hectare.
Thus, the farming community in the study area and other similar agroecological areas could benefit from using the Madiira-II variety with 2.5 kg ha-1 seed rate, which performed maximum leaf yield per plant (38.66 g) and per hectare (25.17 t), and the AC-NL amaranthus variety, which could give the highest leaf yield per hectare (30.84 t).
In contrast to the AC-NL variety, the Madiira-II variety yielded the maximum seed yield per plant (3.78 g) and per hectare (2.53 t). To get a thorough advice, more trials should be carried out at different times of the year and in regions with comparable agronomic methods, as this study was done with additional irrigation. However, as the seed rate increased, the seed yield per hectare showed a little rise; hence, further research will be needed to achieve maximum seed yields. More significantly, it would be beneficial to assess the nutritional profiles and community acceptability of the two types' leaves and grains.
Declarations
Data Availability
Data supporting the findings of this study can be obtained from the corresponding author upon request.
Conflict of Interest
The authors declare that they have no conflicts of interest with respect to the publication of this article.
References
- Suresh, S., Chung, J.W., Cho, G.T., Sung, J.S., Park, J.H., Gwag, J.G. and Baek, H.J., (2014). Analysis of molecular genetic diversity and population structure in Amaranthus germplasm using SSR markers. International Journal of Plant Biosystems, 148(4):635-644.
Publisher | Google Scholor - Stetter, M.G. and Schmid, K.J., (2017). Analysis of phylogenetic relationships and genome size evolution of the Amaranthus genus using GBS indicates the ancestors of an ancient crop. Molecular phylogenetics and evolution, 109:80-92.
Publisher | Google Scholor - Thapa, R., and M. W. Blair. (2018). Morphological assessment of cultivated and wild amaranth species diversity. Agronomy 8:272-275
Publisher | Google Scholor - Qiu, Y. and Liu, G., (2021). Production Guide of Vegetable Amaranth for Florida. EDIS..
Publisher | Google Scholor - Teutonico, R., and Knorr, D., (1985). Amaranth:composition, properties and applications of a rediscovered food crop. Food Technology, 4:49–60.
Publisher | Google Scholor - Muyonga, J.H., Nabakabya, D., Nakimbugwe, D.N. and Masinde, D., (2008). Efforts to promote amaranth production and consumption in Uganda to fight malnutrition. International Union of Food Science & Technology, 1-10.
Publisher | Google Scholor - Mlakar, S.G., Turinek, M., Jakop, M., Bavec, M. and Bavec, F., (2009). Nutrition value and use of grain amaranth:potential future application in bread making. Agricultura, 6(4):43-53.
Publisher | Google Scholor - Shukla S, Bhargava A, Chatterjee A, Srivastava A, Singh SP., (2006). Genotypic variability in vegetable amaranth (Amaranthus tricolor L.) for foliage yield and its contributing traits over successive cuttings and years. Euphytica 151:103-110.
Publisher | Google Scholor - Gimplinger, D.M., Dobos, G., Schonlechner, R. and Kaul, H., (2007). Yield and quality of grain amaranth (Amaranthus sp.) in Eastern Austria. Plant Soil and Environment, 53 (3):105.
Publisher | Google Scholor - Anjali, K., Joshi, A., Maloo, S.R. and Sharma, R., (2013). Assessment of the morphological and molecular diversity in Amaranthus spp. African Journal of Agricultural Research, 8(19):2307-2311.
Publisher | Google Scholor - Alemayehu, F.R., Bendevis, M.A. and Jacobsen, S.E., (2015). The potential for utilizing the seed crop amaranth (Amaranthus spp.) in East Africa as an alternative crop to support food security and climate change mitigation. Journal of Agronomy and Crop Science, 201(5):321-329.
Publisher | Google Scholor - Ogedegbe, S.A., Ajala, B.A. and Ogah, J.J., (2013). Effect of organic fertilizers on leaf and seed yields of amaranth (Amaranthus species L.) varieties in vom, Nigeria. Nigeria Journal of Agriculture, Food and Environment, 9(4):13-18.
Publisher | Google Scholor - Dmitrieva, O. and Ivanov, S., 2020. Comparative study of amaranth species (Amaranthus spp.) in the temperate continental climate of Russian Federation. Acta agriculturae Slovenica, 115(1):15-24.
Publisher | Google Scholor - Mekonnen, G., Woldesenbet, M., Teshale, T. and Biru, T., (2018). Amaranthus caudatus production and nutrition contents for food security and healthy living in Menit Shasha, Menit Goldya and Maji Districts of Bench Maji Zone, Southwestern Ethiopia. Nutrition and Food Science International Journal, 7(3):10-19080.
Publisher | Google Scholor - Amare, E., Mouquet-Rivier, C., Servent, A., Morel, G., Adish, A. and Haki, G.D., (2015). Protein quality of amaranth grains cultivated in Ethiopia as affected by popping and fermentation. Food and Nutrition Sciences, 6(01):38-48
Publisher | Google Scholor - ARBMZ (Annual Report of Bench Maji Zone) 2016. Annual meher crops production report of Bench Maji Zone, SNNPR, Mizan Teferi, Ethiopia.
Publisher | Google Scholor - Siqueira, P.L., Silva, P.S.L., Silva, K.E.F., Oliveira, V.R., Dantas, I.M., and Oliveira, F.H.T. (2014). Soil fertility beneath the crown of tree species submitted to planting densities. Revista Brasileira de Engenharia Agrícola e Ambiental 18(9):914-919.
Publisher | Google Scholor - Asik, B.B., Uzun, A. and Acikgöz, E., (2020). Seeding rate and cultivar impacts on nutrient uptake of field pea under fertile soil condition. Chilean journal of agricultural research, 80 (1):11-20.
Publisher | Google Scholor - Lemerle, D., Verbeek, B., and Diffy, S. (2006). Influence of field pea (Pisumsativum) density on grain yield and competitiveness with annual rye grass (Loliumrigidum) in southeastern Australia. Australian Journal of Experimental Agriculture, 46:465-1472.
Publisher | Google Scholor - Ozturk,A., O.Caglar and S. Bulut, (2005). Growth and Yield Response of Facultative Wheat to winter sowing freezing sowing and spring sowing at different seeding rates. Journal of Agronomy and Crop Science, 192:10-16
Publisher | Google Scholor - Brenner, D.M., Baltensperger, D.D., Kulakow, P.A., Lehmann, J.W., Myers, R.L., Slabbert, M.M. and Sleugh, B.B., (2000). Genetic resources and breeding of Amaranthus. Plant breeding reviews, 19:227-285.
Publisher | Google Scholor - Khajepoor MR. (2000). Principle and fundamental of crop production. Isfahan University of Technology press. 376.
Publisher | Google Scholor - Gisink, J. and Eforn, Y., 1986. Planting date and foliar fertilization of corn grown for silage and grain under limited moisture. Agronomy Journal, 78:426-429.
Publisher | Google Scholor - Sokoto, M.B. and Victor, O., (2017). Growth and yield of amaranth (Amaranthus spp.) as influenced by seed rate and method of planting in Sokoto, Nigeria. Archives of Agriculture and Environmental Science, 2 (1):29-35.
Publisher | Google Scholor - Birhanu, T., (2018). Effect of Nitrogen Levels and Harvesting Frequencies on Growth, Yield Components and Yield of Amaranths (Amaranthus Creuntus, L.) Cultivar Madiira-2. at Jimma, Southwestern Ethiopia. MSc. Thesis, Jimma University College of Agriculture and Veterinary Medicine.
Publisher | Google Scholor - Bongase, E.D., Gemachis, A.O. and Etissa, E., (2018). Response of Seed Yield and Yield Components of Amaranths (Amaranths spp. L.) Varieties under Different plant Density at Jimma. M.Sc. Thesis presented to Jimma University College of Agriculture and Veterinary Medicine.
Publisher | Google Scholor - Ayalew, T., Abebe, B. and Yoseph, T., (2017). Response of Wheat (Tritium aestivum L.) to Variable Seed Rates:the Case of Hawassa Area, Southern Ethiopia. African Journal of Agricultural Research, 12 (14):1177-1181.
Publisher | Google Scholor - Dume, B., Berecha, G., and Tulu, S., (2015). Characterization of biochar produced at different temperatures and its effect on acidic nitosol of Jimma, Southwest Ethiopia. International Journal of Soil Science, 10(2):63
Publisher | Google Scholor - Ebert, A.W., Wu, T.H. and Wang, S.T., (2011). Vegetable amaranth (Amaranthus L.). Intl. Cooperators’ guide. AVRDC–The World Vegetable Center. Publication no., 9:11-754.
Publisher | Google Scholor - Das, S., (2016). Cultivation of Amaranths. In Amaranthus:A Promising Crop of Future. 153-166. Springer, Singapore.
Publisher | Google Scholor - Miah, M.Y., Roy, P.K., Islam, M.S. and Fazal, K.I., (2013). Stem amaranth yield in response to organic manuring. Journal of Environmental Science and Natural Resources, 6(2):19-23.
Publisher | Google Scholor - Sanni, K.O., 2016. Effect of compost, cow dung and NPK 15-15-15 fertilizer on growth and yield performance of Amaranth (Amaranthus hybridus). International Journal of Advances in Scientific Research, 2(3):76-82.
Publisher | Google Scholor - Toungos, M.D.,Babayola, M., Shehu, H.E., Kwaga, Y.M. and Bamai, N., (2018). Effects of Nitrogen Fertilizer on the Growth of Vegetable Amaranths (Amaranthus cruensis L.) in Mubi, Adamawa State Nigeria. Asian Journal of Advances in Agricultural Research,1-12.
Publisher | Google Scholor - Hailu, A.F., Lal, S. and Alameraw, S., (2015). Estimation of association characters in Amaranths germplasm accessions (Amaranthus spp.) under Mizan and Tepicondtions, South West Ethiopia. International Journal of Research, 2(5):1-25.
Publisher | Google Scholor - Mbwambo, O.I.,Books, R.U.F.O.R.U.M., OER, R., SCARDA, R. and Tenders, R.U.F.O.R.U.M., (2013). Morphological characteristics, growth and yield of elite grain and leaf amaranth in Northern Tanzania. Doctoral dissertation, Jomo Kenyatta University of Agriculture and Technology.
Publisher | Google Scholor - Olaniyi, J.O., Adelasoye, K.A., and Jegede, C.O., (2008). Influence of nitrogen fertilizer on the growth, yield and quality of grain amaranths varieties. World Journal of Agricultural Science, 4 (4):506-513
Publisher | Google Scholor - SAS Institute Inc, Statistical Analysis System:Version 9.3, SAS Institute Inc, Cary, NC, USA, (2014).
Publisher | Google Scholor - Casini, P. and La Rocca, F., (2014). Amaranthus cruentus L. is suitable for cultivation in Central Italy:field evaluation and response to plant densities. Italian Journal of Agronomy, 9(4):166-175.
Publisher | Google Scholor - Dinssa, F.F., Yang, R.Y., Ledesma, D.R., Mbwambo, O., Hanson, P., (2018). Effect of leaf harvest on grain yield and nutrient content of diverse amaranth entries. Scientia horticulturae, 236:146–157.
Publisher | Google Scholor - Teshome, M., Tadesse, D. and Ousman, Y., 2020. Effects of seed rates and row spacing on yield and yield components of linseed (Linum usitatissimum L.) at Dabat district of North Gondar Zone, Ethiopia. J. Appl. Biotechnol. Bioeng, 7(1):1-5.
Publisher | Google Scholor - Zubillaga, M.F., Camina, R., Orioli, G.A., Failla, M. and Barrio, D.A., 2020. Amaranth in southernmost latitudes:plant density under irrigation in Patagonia, Argentina. Revista Ceres, 67 (2):93-99.
Publisher | Google Scholor - Pandey, R.M., & SINGH, R. (2009). Genetic improvement of grain amaranths:A review. Current Advances in Agricultural Sciences, 1(2):61-64.
Publisher | Google Scholor - Martínez-Núñez, M., Ruiz-Rivas, M.,Vera-Hernández, P. F., Bernal-Muñoz, R., Luna-Suárez, S., & Rosas-Cárdenas, F. F., (2019). The phenological growth stages of different amaranth species grown in restricted spaces based in BBCH code. South African Journal of Botany, 124:436-443.
Publisher | Google Scholor - Srivastava, R. and Mahavidyalaya, K.M., (2015). Assessment of Morphological Diversity of Selected Amaranthus Species. Journal of Global Biosciences, 4 (8):3044-3048.
Publisher | Google Scholor - Shankar, R., Lal, A., da Silva, J.A.T. and More, T.A., (2012). Diversity analysis of fleshy leaf type Amaranthus for semi-arid ecosystems. International Journal of Plant Breeding, 6:27-33.
Publisher | Google Scholor - Liu, F. and Stützel, H., (2004). Biomass partitioning, specific leaf area, and water use efficiency of vegetable amaranth (Amaranthus spp.) in response to drought stress. Scientia horticulturae, 102 (1):15-27.
Publisher | Google Scholor - Yarnia, M., Benam, M.K. and Tabrizi, E.F.M., (2010). Sowing dates and density evaluation of amaranth (cv. Koniz) as a new crop. Journal of Food, Agriculture & Environment, 8 (2):445-448.
Publisher | Google Scholor - Rotich, A.N., Gweyi-Onyango, J.P. and Korir, N.K., (2017). Diagonal offset arrangement and spacing architecture effect on growth and yield components of grain amaranth in Kenya. Asian Research Journal of Agriculture, 6(1):1-8
Publisher | Google Scholor - Poorter, H.,Niinemets, Ü. Poorter, L.,Wright, I.J. and Villar, R., (2009). Causes and consequences of variation in leaf mass per area (LMA):meta‐analysis. New phytologist, 182(3):565-588.
Publisher | Google Scholor - Weraduwage, S.M., Chen, J., Anozie, F.C., Morales, A., Weise, S.E. and Sharkey, T.D., (2015). The relationship between leaf area growth and biomass accumulation in Arabidopsis thaliana. Frontiers in plant science, 6:167.
Publisher | Google Scholor - Shahzad, M.A., W.U. Din., S.T. Sahi., M.M. Khan., Ehsanullah and M. Ahmad. (2007) . Effect of sowing dates and seed treatment on grain yield and quality of wheat. Pakistan journal of biological sciences, 44 (4):581-583.
Publisher | Google Scholor - Naveed, K., Khan, M.A., Baloch, M.S., Ali, K., Nadim, M.A., et al, (2014). Effect of different seeding rates on yield attributes of dual-purpose wheat. Sarhad journal of agriculture, 30(1).
Publisher | Google Scholor - Gnan, S., Marsh, T. and Kover, P.X., (2017). Inflorescence photosynthetic contribution to fitness releases Arabidopsis thaliana plants from trade-off constraints on early flowering. PLoS One, 12(10):1-9.
Publisher | Google Scholor - Tejaswini, N., Saidaiah, P., Ravinder Reddy, K. and Ramesh, T., (2017). Evaluation of vegetable amaranth (Amaranthus tricolor, L.) genotypes for yield and yield attributing traits. Journal of Pharmacognosy and Phytochemistry, 6(6):2572-2578.
Publisher | Google Scholor - Henderson, T.L, Johnson, B.L, Schneiter, A.A., (2000). Row spacing, plant population and cultivar effects on grain amaranth in the Northern Great Plains. Agronomy Journal 92:329-336.
Publisher | Google Scholor - Abbas G, Ali MA, Azam M, Hussain I., (2009). Impact of Planting Methods on Wheat Grain Yield and Yield Contributing parameters. Journal of Animal and Plant Sciences, 19(1):30-33.
Publisher | Google Scholor - Baloch, M.S., Shah, I.T.H., Nadim, M.A., Khan, M.I. and Khakwani, A.A., (2010). Effect of seeding density and planting time on growth and yield attributes of wheat. Journal of Animal and Plant Science, 20(4):239-240.
Publisher | Google Scholor - Olofintoye JAT, Adeniyi HA, Adetula OA. (2011). Effects of phosphorus fertilizer and intra row spacing on the growth and yield of grain amaranth (Amaranthus cruentus). Agricultural Journal 6:366–368.
Publisher | Google Scholor - Maseko, I., Mabhaudhi, T., Beletse, Y.G., Nogemane, N., Du Plooy, C.P. and Modi, A.T., (2018). Growth and yield responses of Amaranthus cruentus, Corchorus olitorius and Vigna unguiculata to nitrogen application under drip irrigated commercial production. In XXX International Horticultural Congress IHC2018:International Symposium on Water and Nutrient Relations and Management of 1253:303-310.
Publisher | Google Scholor - Sulieman, S.A., (2010). The Influence of Triticum asetivum seeding rates and sowing patterns on the vegetative characteristics in Shambat soil under irrigation. Research Journal of Agriculture and Biological Sciences, 6(2):93-102.
Publisher | Google Scholor - Garba, A.A., Mahmoud, B.A., Adamu, Y. and Ibrahim, U., (2013). Effect of variety, seed rate and row spacing on the growth and yield of rice in Bauchi, Nigeria. African Journal of Food, Agriculture, Nutrition and Development, 13(4):8155-8166.
Publisher | Google Scholor - Caliskan, S., Arslan, M., Arioglu, H. and Isler, N., (2004). Effect of planting method and plant population on growth and yield of sesame (Sesamum indicum L.) in a Mediterranean type of environment. Asian Journal of Plant Sciences, 3(5):610-613.
Publisher | Google Scholor - Chundawat, R.S., Patidar, D.K., Haldar, A. and Meena, K.C., (2017). Growth and Seed Yield of Asalio (Lepidium Sativum L.) as Influenced by Seed Rates and Sowing Methods. Current Agriculre Research Journal. 5 (3):288-291
Publisher | Google Scholor - Majumder, U.N.M., (2007). Effect of Nitrogen and Spacing on Growth and Yield of Stem Amaranth (Amaranthus viridus L.). M.Sc. Thesis. Department of Horticulture and Postharvest Technology Shere Bangla Agricultural University.
Publisher | Google Scholor - Lauer, J.G., Roth, G.W. and Bertram, M.G., (2004). Impact of defoliation on corn forage yield. Agronomy Journal, 96 (5):1459-1463.
Publisher | Google Scholor - Ahmadi, A. and Joudi, M., (2007). Effects of timing and defoliation intensity on growth yield and gas exchange rate of wheat grown under well-watered and drought conditions. Pakistan journal of biological sciences:PJBS, 10(21):3794-3800.
Publisher | Google Scholor - Gondal, M.R., Hussain, A., Yasin, S., Musa, M. and Rehman, H.S., (2017). Effect of seed rate and row spacing on grain yield of sorghum. SAARC Journal of Agriculture, 15(2):81-91.
Publisher | Google Scholor - Kashiwagi, T., Togawa, E., Hirotsu, N., and Ishimaru, K., (2008). Improvement of lodging resistance with QTLs for stem diameter in rice (Oryza sativa L.) Theory and Applied Genetics, 117:749-757.
Publisher | Google Scholor - Venuto, B., and Kindiger, B. (2008). Forage and biomass feedstock production from hybrid forage sorghum and sorghum Sudan grass hybrids. Grassland Science, 54:189-196.
Publisher | Google Scholor - Igbokwe, P.E. and Hollins, S., (2000). Response of vegetable amaranth to plant spacing. Journal of Vegetable Crop Production, 6(2):75-85.
Publisher | Google Scholor - Snider, J.L., Raper, R.L., and Schwab, E.B., (2012). The effect of row spacing and seed rate on biomass production and plant stand characteristics of non-irrigated photo period sensitive sorghum (Sorghum bicolor L. Moench). Industrial Crops and Products, 37:527-535.
Publisher | Google Scholor - Patel, P.S., Alagundagi, S.C., Mansur, C.P., Kubsad, V.S., Hosamani, S.V. and Megeri, S.N., (2012). Effect of row spacing and seed rate on growth, fodder productivity and economics of amaranth genotypes. Karnataka Journal of Agricultural Sciences, 24(5):643-650.
Publisher | Google Scholor - Pourfarid, A., Kamkar, B. and Akbari, G.A., (2014). The effect of density on yield and some agronomical and physiological traits of Amaranth (Amaranthus spp). International Journal of Farming and Allied Sciences, 3(12):1256-1259.
Publisher | Google Scholor - Wilson, P.J., Thompson, K.E.N. and Hodgson, J.G., 1999. Specific leaf area and leaf dry matter content as alternative predictors of plant strategies. The New Phytologist, 14(1):155-162.
Publisher | Google Scholor - Baturaygil, A., Stetter, M.G. and Schmid, K., (2021). Breeding Amaranth for Biomass:Evaluating Dry Matter Content and Biomass Potential in Early and Late Maturing Genotypes. Agronomy, 1(5):970.
Publisher | Google Scholor - Varalakshmi, B., (2004). Characterization and preliminary evaluation of vegetable amaranth (Amaranthus spp.) germplasm. Plant Genetic Resources Newsletter.
Publisher | Google Scholor - Khan, E.A., Aslam, M., Ahmad, H.K., Ayaz, M. and Hussain, A., 2010. Effect of row spacing and seeding rates on growth yield and yield components of chickpea. Sarhad Journal of Agriculture, 26(2):201-211.
Publisher | Google Scholor - Apaza-Gutierrez, V., Romero-Saravia, A., Guillen-Portal, F.R. and Baltensperger, D.D., 2002. Response of grain amaranth production to density and fertilization in Tarija, Bolivia. Trends in new crops and new uses. ASHS Press, Alexandria, 107-109.
Publisher | Google Scholor - Roitner-Schobesberger, B. and Kaul, H.P., (2013). Source capacity during flowering affects grain yield of amaranth (Amaranthus sp.). Plant, Soil and Environment, 59(10):472-477.
Publisher | Google Scholor - Guillen-Portal, F.R., Baltensperger, D.D. and Nelson, L.A., 1999. Plant population influence on yield and agronomic traits in Plainsman grain amaranth. Perspectives on New Crops and New Uses. ASHS Press, Alexandria, 190-193.
Publisher | Google Scholor - Wnuk, A., Górny, A.G., Bocianowski, J. and Kozak, M., (2013). Visualizing harvest index in crops. Communications in Biometry & Crop Science, 8(2):48–59
Publisher | Google Scholor - Borrás, L., Slafer, G.A. and Otegui, M.E., (2004). Seed dry weight response to source–sink manipulations in wheat, maize and soybean:a quantitative reappraisal. Field Crops Research, 86(2-3):131-146.
Publisher | Google Scholor