
Research Article
Empowering Women in Bangladesh: Uncovering Patterns and Key Determinants with Advanced Data-Driven Insights
- Md Mamunur Rashid *
Department of Popualtion Science, Jatiya Kabi Kazi Nazrul Islam University, Mymensingh, Bangladesh.
*Corresponding Author: Md Mamunur Rashid, Department of Popualtion Science, Jatiya Kabi Kazi Nazrul Islam University, Mymensingh, Bangladesh.
Citation: Rashid M. (2026). Empowering Women in Bangladesh: Uncovering Patterns and Key Determinants with Advanced Data-Driven Insights, Journal of BioMed Research and Reports, BioRes Scientia Publishers. 10(1):1-14. DOI: 10.59657/2837-4681.brs.26.227
Copyright: © 2026 Mamunur Rashid, this is an open-access article distributed under the terms of the Creative Commons Attribution License, which permits unrestricted use, distribution, and reproduction in any medium, provided the original author and source are credited.
Received: December 29, 2025 | Accepted: January 12, 2026 | Published: January 20, 2026
Abstract
Background: Women’s empowerment is essential for well-being and sustainable development. It enables individuals to take control of their lives and engage in their communities. In Bangladesh, identifying key factors influencing empowerment is crucial to overcoming barriers and promoting equity. This study aims to identify key indicators of women’s empowerment, examine their distribution across different empowerment levels, assess the impact of these indicators with emphasis on urban-rural disparities, investigate reasons for low empowerment, and propose relevant policy interventions.
Methods: This study utilizes secondary data from the 2022 Bangladesh Demographic and Health Survey (BDHS) to assess women's empowerment. Descriptive statistics outline key empowerment indicators, while the ordinal logistic regression model evaluates the influence of socio- demographic factors. Association rule mining further identifies patterns among women with lower empowerment, offering nuanced insights across rural and urban contexts.
Results: Findings depict that 47.85% of women were categorized as highly empowered, while 34.82% fell into the low empowerment category, highlighting significant gaps in empowerment. Factors such as age, education, economic participation, media access, and decision-making autonomy strongly influenced women’s empowerment. Older, educated women and those involved in joint household decisions exhibited higher empowerment. However, rural-urban and regional disparities were notable, with rural women and those in underserved areas, like Sylhet, facing greater challenges.
Conclusion: The findings emphasize the need for targeted interventions to enhance women’s empowerment. Prioritizing education, expanding economic opportunities, improving access to media and reproductive autonomy, and addressing regional disparities are essential steps toward achieving equitable and comprehensive empowerment.
Keywords: decision-making autonomy; empowerment indicators; ordinal logistic regression; socio-demographic factors; women’s empowerment
Introduction
Women’s empowerment is widely recognized as a key instrument for promoting the overall well- being of women worldwide [1]. It is a multi-dimensional process that enables people to gain control over their lives, communities, and society by addressing important issues. Similarly, women’s empowerment involves gaining the ability to make strategic life choices previously denied to them, which is crucial for sustaining benefits at the individual, household, community, and broader levels [2]. This concept extends significantly to women’s empowerment, encompassing economic, social, political, and cultural dimensions. Women’s empowerment is not only an intrinsic human rights goal but also has significant implications for women's and their children's health and well-being. Today, incorporating women into the development process and encouraging their participation in economic activities alongside men has become increasingly important in national development plans [3]. Bangladesh ranks 65th out of 156 countries in the Global Gender Gap Index, reflecting ongoing gender inequality across key areas such as education, health, political empowerment, and economic participation (World Economic Forum, 2021). Addressing these inequalities requires targeted efforts to enhance women's empowerment across all dimensions. By improving access to education, healthcare, and economic opportunities, and by challenging societal norms, we can foster a more equitable society where women can fully realize their potential and contribute to sustainable development.
Research on women’s empowerment reveals significant socio-economic disparities. Women in urban areas and those engaged in income-generating activities are generally more empowered than their rural counterparts [3,5,6] and the type of place of residence plays a significant role in women’s empowerment in Bangladesh [3]. Within the family context, many women in Bangladesh still face barriers, including limited freedom of mobility, participation in decision-making, and control over resources [7]. However, some studies show that many married women can make joint household and economic decisions, particularly those in urban areas and those employed, indicating a gradual shift towards more equitable decision-making practices in some [3]. Additionally, factors such as lower spousal age differences and fewer daughters are linked to higher empowerment, while early marriage and rural residence correlate with lower empowerment. Education, smaller family sizes, media exposure, NGO involvement, and employment outside the home positively impact women's empowerment [8].
Micro-credit programs have significantly boosted women's empowerment, showing their potential to enhance economic conditions [1]. Economic activity among women remains low, with many engaged in non-professional roles. The study highlights that poorer, less educated, and rural woman are more economically active despite their limited opportunities (M. E. Haque & Sarkar, 2021). Higher empowerment levels are also positively associated with maternal healthcare utilization, underscoring the need for policies that address empowerment to expand health service use [10]. Moreover, this empowerment can also influence male antenatal involvement, either positively or negatively [11]. Empowered women are also more likely to use modern contraceptives, with a usage rate of 55.3% overall. In contrast, this rate drops to 51.6% among women who are not empowered, who also experience 13% lower odds of using these methods. Furthermore, joint decision-making with husbands significantly increased the likelihood of contraceptive use [12]. Interestingly, another study found that childhood diarrhea prevalence in Bangladesh was 5% for 2017-18. Although no significant link between women's empowerment and diarrhea was found, children of less empowered mothers were less likely to experience it [13]. Over time, empowerment levels have shown notable improvements, with more women participating in decision-making and protesting against violence. This progress indicates a positive trend towards greater empowerment and social change [5]. Despite growing empowerment, 20.5% of women still approve of some form of spousal violence [14]. Addressing IPV requires economic empowerment tailored to the specific needs of urban and rural areas, as well as targeted interventions for different age groups [15].
Despite significant findings, gaps remain in understanding women’s empowerment, as traditional models often fail to capture complex interactions between factors. Key indicators such as education, wealth, and employment status significantly influence empowerment (Akter et al., 2024; M. E. Haque & Sarkar, 2021; M. M. Haque et al., 2011; Sen & Nilima, 2018; Tabassum et al., 2019), but their effects may vary depending on residential context, with some playing a more decisive role. This study addresses these gaps by incorporating interaction effects and advanced analytical methods to enhance predictive accuracy and provide deeper insights. It also explores the underlying causes of low empowerment, identifying the absence of critical factors that create barriers to progress. Using BDHS 2022 data, the research examines how empowerment-related factors are distributed, how residential status influences them, and why some women face greater obstacles. By uncovering these dynamics, the study offers valuable insights to inform targeted policies and interventions, ultimately fostering a more equitable society.
Materials and Methods
Data source
The data for this research is derived from the 2022 Bangladesh Demographic and Health Survey (BDHS). This survey is conducted by the National Institute of Population Research and Training (NIPORT) and ICF with support from USAID/Bangladesh, and it highlights major health changes since 1993-94. Our study focuses on individual records. The 2022 BDHS was carried out as part of the global Demographic and Health Survey (DHS) program. Out of 30330 selected households, 30149 were occupied, and 30018 were successfully interviewed, achieving a response rate of 99.6%. Among the interviewed households, 30358 ever-married women aged 15–49 years were eligible for individual interviews, and 30078 were successfully interviewed, resulting in a 99.1% response rate. Of the eligible women, 20217 were chosen for the full questionnaire, with 18987 completing the interview, yielding a 93.9% response rate for the full questionnaire and 99.5% for the short one (NIPORT, Ministry of Health and Family Welfare, & The DHS Program, ICF, 2024).
Outcome measure
For our study, we considered indicators available in the study year and excluded variables with 40% or more missing observations. Consequently, we have a total of 9 indicators broadly classified into two dimensions: a) household decision making, b) attitudes toward wife beating [5]. The first dimension includes 3 questions, each with 5 possible answers, while the second includes 5 questions, each with binary answers [Figure 1]. The authors converted responses into a dichotomous format:
Household decision-making (4 indicators): "Yes" (coded as 1) for responses among the first 3 categories (respondent alone, respondent and husband/partner, respondent and other person), otherwise "No" (coded as 0).
Attitudes toward wife beating (5 indicators): As these are negatively related to empowerment, 'Yes' is coded as 0 and 'No' as 1 [5,8].
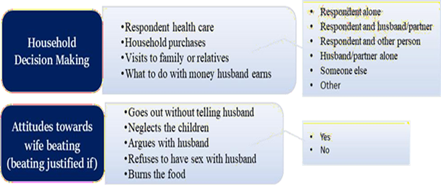
Figure 1:Women’s Empowerment Indicators
Indexes are generated for each dimension, constructed following the Human Development Index (HDI) methodology by the United Nations Development Program (UNDP 2005) using the formula below:
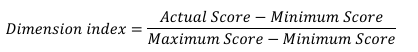
The actual score is the sum of all positive responses, while the maximum score represents the sum of all possible positive responses. The minimum score is set to 0 [6,16]. The two indices are summed up to generate the final empowerment score. This composite score reflects the overall empowerment level of individuals in the study. Once the composite score is calculated, it is divided into three equal categories based on quantile distribution. These categories are: Low (below the 1st quantile), Medium (between the 1st and 2nd quantiles), and High (above the 2nd quantile) [5]. This categorization helps in analyzing the distribution of empowerment levels across the study population.
Covariates
The data includes various demographic and household variables. Age is grouped into 5-year ranges: 15-19, 20-24, 25-29, 30-34, 35-39, 40-44, and 45-49 years. The place of residence is classified as rural or urban. Education level is categorized into no education, primary, secondary, higher, and don't know (for husband/partner’s education level). De jure region of residence is categorized by districts such as Abroad, Barisal, Chittagong, Dhaka, Khulna, Mymensingh, Rajshahi, Rangpur, Sylhet, and Not de jure resident. Frequency of reading newspapers or magazines, listening to the radio, and watching television is grouped as not at all, less than once a week, at least once a week, and almost every day. The wealth index includes the poorest, poorer, middle, richer, and richest. Decision maker for using contraception is classified into the respondent, husband/partner, and joint decision. Respondent is currently working is marked as yes or no. Ownership of a house and land is categorized into does not own, alone only, jointly with someone else only, jointly with husband/partner only, and both alone and jointly. Finally, employment just before marriage is recorded as yes or no.
Statistical Analysis
A range of statistical analyses, including univariate, bivariate, and multivariate methods, were performed on the DHS data. Initially, univariate frequency distributions were used to explore the distribution of women’s empowerment indicators. Subsequently, bivariate frequency distributions assessed how women's empowerment status varied across these indicators. To examine the influence of these indicators on empowerment status, an ordinal logistic regression model was applied, incorporating interaction effects with place of residence (urban vs. rural). Chi-squared tests were conducted to evaluate the significance of associations, and a likelihood ratio test was used to assess the goodness-of-fit of the model [17]. Lastly, association rule mining was employed to uncover key combinations of indicators associated with lower levels of women’s empowerment [18].
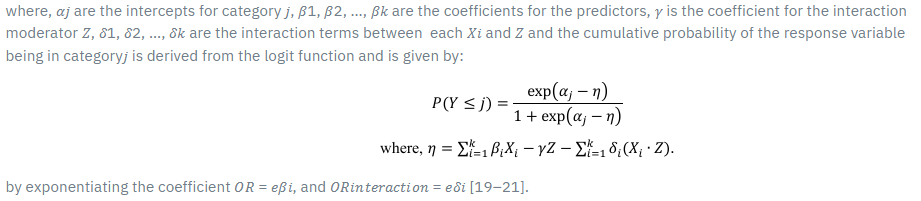
Ordinal Logistic Regression Model
For qualitative response variables, models such as binary logistic, ordinal logistic, and multinomial logistic regression are commonly used for data analysis. However, when dealing with polychotomous data where the response variable follows a natural order, the ordinal logistic regression model tends to provide more precise and reliable estimates of the regression coefficients. In this study, the response variable, women’s empowerment, consists of three ordered categories: low, medium, and high. Therefore, the proportional odds model (POM) was selected as the appropriate analytical approach.
Let, Y denote the ordinal response variable representing women's empowerment status, which has three ordered categories:
Y = {1=Low, 2=Medium, 3=High}.
Let X1, X2, …, X k be a set of independent variables (empowerment indicators), and Z be a moderator (e.g., place of residence: urban/rural). The Proportional Odds Model assumes that the cumulative odds of being at or below a certain category j (where, j = 1,2) is modeled as; P(Y ≤ j)

Results
The majority of women are highly empowered, with 77.06% in urban areas and 73.13% in rural areas falling into this category. Medium empowerment is slightly more common among rural women (24.82%) compared to urban women (21.66%). Low empowerment remains minimal in both settings but is higher in rural areas (2.05%) than in urban areas (1.28%). Overall, urban women exhibit a modest advantage in empowerment status, with a higher proportion in the high category and fewer in the lower categories (Figure 2).
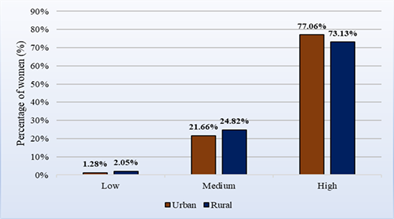
Figure 2:Women's Empowerment Status 2022
Table 1 presents a detailed view of various aspects of women's empowerment, combining insights from demographic, socioeconomic, and behavioral variables. Each variable reveals distinct trends, reflecting progress in certain areas while identifying significant gaps.
Table 1: Distribution of Women's Empowerment Indicators
| Variable | Frequency | Percentage (%) | Cumulative Percentage (%) |
| Age (Years) | |||
| 15-19 | 1603 | 8.4 | 8.4 |
| 20-24 | 3147 | 25.0 | |
| 25-29 | 3440 | 43.1 | |
| 30-34 | 3299 | 60.5 | |
| 35-39 | 3185 | 77.3 | |
| 40-44 | 2351 | 89.7 | |
| 45-49 | 1962 | 100.0 | |
| Placeof residence | |||
| Urban | 6622 | 34.9 | |
| Rural | 12365 | 100.0 | |
| Highest educational level | |||
| No education | 2432 | 12.8 | |
| Primary | 4893 | 38.6 | |
| Secondary | 8808 | 85.0 | |
| Higher | 2854 | 15.0 | 100.0 |
| De jure regionof residence (Division) | |||
| Barishal | 2033 | 10.7 | 10.7 |
| Chattogram | 2821 | 14.9 | 25.6 |
| Dhaka | 2871 | 15.1 | 40.7 |
| Khulna | 2478 | 13.1 | 53.7 |
| Mymensingh | 2051 | 10.8 | 64.5 |
| Rajshahi | 2439 | 12.8 | 77.4 |
| Rangpur | 2298 | 12.1 | 89.5 |
| Sylhet | 1996 | 10.5 | 100.0 |
| Frequency of reading a newspaper or a magazine | |||
| Not at all | 17643 | 92.9 | 92.9 |
| Less than once a week | 799 | 4.2 | 97.1 |
| At leastonce a week | 545 | 2.9 | 100.0 |
| Frequency of listening to theradio | |||
| Not at all | 18399 | 96.9 | 96.9 |
| Less than once a week | 354 | 1.9 | 98.8 |
| At leastonce a week | 234 | 1.2 | 100.0 |
| Frequency of watching television | |||
| Not at all | 8288 | 43.7 |
43.7 |
| Less than once a week | 1400 | 7.4 | 51.0 |
| At leastonce a week | 9299 | 49.0 | 100.0 |
| Wealth index | |||
| Poorest | 3357 | 17.7 | 17.7 |
| Variable | Frequency | Percentage (%) | Cumulative Percentage (%) |
| Poorer | 3727 | 19.6 | 37.3 |
| Middle | 3786 | 19.9 | 57.2 |
| Richer | 3940 | 20.8 | 78.0 |
| Richest | 4177 | 22.0 | 100.0 |
| Decision maker for using contraception | |||
| Respondent | 2121 | 11.2 | 11.2 |
| Husband/partner | 1684 | 8.9 | 20.0 |
| Joint decision | 14932 | 78.6 | 98.7 |
| Someone else | 102 | 0.5 | 99.2 |
| Other | 148 | 0.8 | 100.0 |
| Husband/partner's education level | |||
| No education | 4011 | 21.1 | 21.1 |
| Primary | 5306 | 27.9 | 49.1 |
| Secondary | 6092 | 32.1 | 81.2 |
| Higher | 3545 | 18.7 | 99.8 |
| Don't know | 33 | 0.2 | 100.0 |
| Respondent is currently working | |||
| No | 13281 | 69.9 | 69.9 |
| Yes | 5706 | 30.1 | 100.0 |
| Ownsa house aloneor jointly | |||
| Does not own | 17820 | 93.9 | 93.9 |
| Alone only | 511 | 2.7 | 96.5 |
| Jointly withhusband/partner only | 431 | 2.3 | 98.8 |
| Jointly withsomeone else only | 72 | 0.4 | 99.2 |
| Jointly with husband/partner and someone else | 121 | 0.6 | 99.8 |
| Both alone and jointly | 32 | 0.2 | 100.0 |
| Ownsland alone or jointly | |||
| Does not own | 18143 | 95.6 | 95.6 |
| Alone only | 594 | 3.1 | 98.7 |
| Jointly withhusband/partner only | 159 | 0.8 | 99.5 |
| Jointly withsomeone else only | 44 | 0.2 | 99.8 |
| Jointly with husband/partner and someone else | 27 | 0.1 | 99.9 |
| Both alone and jointly | 20 | 0.1 | 100.0 |
| Employment just before marriage | |||
| No | 17414 | 91.7 | 91.7 |
| Yes | 1573 | 8.3 | 100.0 |
| Empowerment category | |||
| Low | 339 | 1.8 | 1.8 |
| Medium | 4503 | 23.7 | 25.5 |
| High | 14145 | 74.5 | 100.0 |
Most women fall within the central reproductive years: 18.1% are aged 25–29 years, 17.4% are 30–34 years, and 16.8% are 35–39 years, together making up 52.3% of the sample. Only 8.4% are adolescents (15–19 years), and 10.3% are aged 45–49 years. These figures show that the study mainly reflects women at the peak of household, social, and economic engagement. A majority (65.1%) live in rural areas, so the empowerment outcomes mostly reflect rural settings, where norms and access to services are more limited. Regionally, Dhaka (15.1%) and Chattogram (14.9%) have the largest shares, followed by Khulna (13.1%), Rajshahi (12.8%), Rangpur (12.1%), Mymensingh (10.8%), Barishal (10.7%), and Sylhet (10.5%). This balanced distribution supports regional comparisons. In terms of education, 46.4% of women completed secondary education, 25.8% primary, and 15.0% higher; however, 12.8% have no education. This gap limits autonomy and leadership. Among husbands, 32.1% completed secondary, 27.9% primary, 18.7% higher education, and 21.1% have no education, which can influence women’s empowerment depending on household dynamics. Most women have very limited access to media: 92.9% never read newspapers or magazines, and 96.9% never listen to the radio. Only 2.9% read print weekly, and 1.2% listen to the radio. However, 49.0% watch TV weekly, while 43.7% do not. This limited exposure restricts access to empowering information.
The sample includes a fairly even wealth distribution: richest (22.0%), richer (20.8%), middle (19.9%), poorer (19.6%), and poorest (17.7%). This balance allows meaningful socioeconomic comparisons. Only 30.1% of women currently work, and just 8.3% worked before marriage, which reflects low economic engagement. Regarding contraceptive use, 78.6% make decisions jointly with their partners, while only 11.2 percentage decide alone, showing limited reproductive control. Property ownership remains rare: 93.9 percentage of women do not own a house, and only 2.7 percentage own one individually. Similarly, 95.6% own no land, while just 3.1% own land alone. This lack of ownership reduces economic power and bargaining ability. Despite these constraints, 74.5 percentage of women fall into the highly empowered group, 23.7 percentage into medium, and only 1.8% into low empowerment. While high empowerment appears dominant, decision-making variables may heavily influence the index and mask deeper inequalities in education, media access, economic activity, and asset control.
Table 2 shows the association between empowerment status (low, medium, high) and various indicators, displaying Chi-square values and p-values to identify significant relationships.
Table 2: Distribution of Women's Empowerment Status
| Variable | Total Respondent (n=18981) | Low(%) (n=339) | Medium(%) (n=4503) | High(%) (n=14145) |
| Age(Years) | ||||
| 15-19 | 1603 | 3.0 | 41.4 | 55.6 |
| 20-24 | 3147 | 1.8 | 31.5 | 66.7 |
| 25-29 | 3440 | 1.4 | 23.5 | 75.2 |
| 30-34 | 3299 | 1.4 | 19.5 | 79.2 |
| 35-39 | 3185 | 1.8 | 17.8 | 80.4 |
| 40-44 | 2351 | 1.9 | 17.2 | 80.9 |
| 45-49 | 1962 | 2.1 | 21.6 | 76.3 |
| X2 = 38.08 | P = less than 0.001 | |||
| Placeof residence | ||||
| Urban | 6622 | 1.3 | 21.7 | 77.1 |
| Rural | 12365 | 2.1 | 24.8 | 73.1 |
| X2 = 16.93 | P = less than 0.001 | |||
| Highest educational level | ||||
| No Education | 2432 | 2.9 | 23.1 | 74.0 |
| Primary | 4893 | 2.2 | 23.7 | 74.1 |
| Secondary | 8808 | 1.6 | 25.2 | 73.2 |
| Higher | 2854 | 0.6 | 19.6 | 79.8 |
| X2 = 10.07 | P = less than 0.001 | |||
| Regionof residence (Division) | ||||
| Barishal | 2033 | 0.9 | 29.6 | 69.5 |
| Chattogram | 2821 | 1.4 | 20.3 | 78.3 |
| Dhaka | 2871 | 2.1 | 20.4 | 77.5 |
| Khulna | 2478 | 2.7 | 28.3 | 69.0 |
| Mymensingh | 2051 | 1.5 | 23.7 | 74.8 |
| Rajshahi | 2439 | 1.9 | 20.3 | 77.8 |
| Rangpur | 2298 | 1.3 | 18.2 | 80.5 |
| Sylhet | 1996 | 2.4 | 32.1 | 65.5 |
| − | P = less than 0.001 | |||
| Frequency of reading a newspaper or a magazine | ||||
| Variable | Total Respondent (n=18981) | Low(%) (n=339) | Medium(%) (n=4503) | High(%) (n=14145) |
| Not at all | 17643 | 1.8 | 24.1 | 74.0 |
| Less than once a week | 799 | 1.3 | 20.2 | 78.6 |
| At leastonce a week | 545 | 0.7 | 16.0 | 83.3 |
| − | P = less than 0.001 | |||
| Frequency of listening to theradio | ||||
| Not at all | 18399 | 1.8 | 23.7 | 74.5 |
| Less than once a week | 354 | 1.1 | 26.0 | 72.9 |
| At leastonce a week | 234 | 0.9 | 24.8 | 74.4 |
| − | P = less than 0.23 | |||
| Frequency of watching television | ||||
| Not at all | 8288 | 2.1 | 26.3 | 71.6 |
| Less than once a week | 1400 | 1.4 | 27.1 | 71.5 |
| At leastonce a week | 9299 | 1.6 | 20.9 | 77.6 |
| − | p = <0> | |||
| Wealth index | ||||
| Poorest | 3357 | 2.6 | 25.0 | 72.4 |
| Poorer | 3727 | 2.0 | 25.6 | 72.4 |
| Middle | 3786 | 1.7 | 24.3 | 74.0 |
| Richer | 3940 | 1.8 | 23.6 | 74.7 |
| Richest | 4177 | 1.0 | 20.6 | 78.4 |
| X2 = 5.27 | P = less than 0.001 | |||
| Decision maker for using contraception | ||||
| Respondent | 2121 | 2.0 | 28.3 | 69.7 |
| Husband/partner | 1684 | 4.0 | 52.3 | 43.7 |
| Joint decision | 14932 | 1.5 | 19.5 | 79.0 |
| Someone else | 102 | 2.9 | 52.0 | 45.1 |
| Other | 148 | 4.7 | 35.8 | 59.5 |
| X2 = 96.78 | P = less than 0.001 | |||
| Husband/partner's education level | ||||
| No education | 4011 | 2.5 | 22.3 | 75.1 |
| Primary | 5306 | 2.0 | 24.5 | 73.4 |
| Secondary | 6092 | 1.6 | 25.2 | 73.2 |
| Higher | 3545 | 0.8 | 21.4 | 77.8 |
| Don’t know | 33 | 0.0 | 42.4 | 57.6 |
| X2 = 5.86 | P = less than 0.001 | |||
| Respondent is currently working | ||||
| No | 13281 | 1.9 | 27.0 | 71.1 |
| Variable | Total Respondent (n=18981) | Low(%) (n=339) | Medium(%) (n=4503) | High(%) (n=14145) |
| Yes | 5706 | 1.6 | 16.0 | 82.4 |
| X2 = 87.07 | p = <0> | |||
| Ownsa house aloneor jointly | ||||
| Does not own | 17820 | 1.8 | 24.0 | 74.3 |
| Alone only | 511 | 2.2 | 16.8 | 81.0 |
| Jointly withhusband/partner only | 431 | 2.1 | 22.3 | 75.6 |
| Jointly withsomeone else only | 72 | 1.4 | 18.1 | 80.6 |
| Jointly with husband/partner &someone else | 121 | 0.8 | 25.6 | 73.6 |
| Both alone and jointly | 32 | 3.1 | 12.5 | 84.4 |
| X2 = 1.57 | p = 0.12 | |||
| Ownsland alone or jointly | ||||
| Does not own | 18143 | 1.8 | 24.0 | 74.2 |
| Alone only | 594 | 2.2 | 16.5 | 81.3 |
| Jointly withhusband/partner only | 159 | 4.4 | 15.7 | 79.9 |
| Jointly withsomeone else only | 44 | 2.3 | 18.2 | 79.6 |
| Jointly with husband/partner &someone else | 27 | 0.0 | 14.8 | 85.2 |
| Both alone and jointly | 20 | 0.0 | 35.0 | 65.0 |
| X2 = 1.90 | p = 0.06 | |||
| Employment just before marriage | ||||
| No | 17414 | 1.8 | 24.2 | 74.0 |
| Yes | 1573 | 1.6 | 18.7 | 79.7 |
| X2 = 8.21 | P = less than 0.001 | |||
Findings revealed that empowerment rises with age, and this relationship is statistically significant (p = 0.00). Only 55.6% of women aged 15–19 years are highly empowered, increasing to 80.9% among those aged 40–44. Women aged 35–39 years and 45–49 years also show high empowerment at 80.4% and 76.3%. Medium empowerment peaks at 41.4% in the youngest group and declines with age. Low empowerment stays below 3.0% but appears higher among the youngest (3.0%) and oldest (2.1%). Urban women report 77.1% high empowerment versus 73.1% among rural women, with this difference statistically significant. Rural women also show higher medium (24.8%) and low empowerment (2.1%) than urban women (21.7% and 1.3%). Rangpur (80.5%) and Chattogram (78.3%) lead in high empowerment, followed by Rajshahi (77.8%) and Dhaka (77.5%). Barishal (69.5%), Khulna (69.0%), and Sylhet (65.5%) report the lowest. Sylhet also shows the highest medium (32.1%) and elevated low empowerment (2.4%). Education strongly affects empowerment, with highly significant associations. Among highly educated women, 79.8% are highly empowered, and 0.6 percentage fall into the low group. Secondary and primary education correspond with 73.2% and 74.1% high, and 1.6% and 2.2% low empowerment. Women with no education show 74.0% high and 2.9% low empowerment. Husbands’ higher education corresponds to 77.8% high and 0.8% low empowerment. For secondary, primary, and no education, the figures are 73.2%, 73.4%, and 75.1% high, with 1.6%, 2.0%, and 2.5% low, respectively.
Media exposure mostly shows significant effects except for radio listening (p > 0.05). Among women who read newspapers weekly, 83.3% are highly empowered, and 0.7 percentage fall into the low group. Non-readers show 74.0% high and 1.8% low. Watching TV weekly results in 77.6% high empowerment, compared to 71.6% among non-viewers. Radio listeners show 74.4% high and 0.9% low, but this difference is not statistically significant. Wealth shows a positive and significant relationship with empowerment. The richest group reports 78.4% high and 1.0% low empowerment; the poorest show 72.4% high and 2.6% low. The middle group reports 74.0% high and 1.7% low empowerment. As wealth increases, medium and low empowerment decrease. Contraceptive decision-making is strongly significant. Joint decisions lead to 79.0% high and 1.5% low empowerment. When husbands decide alone, only 43.7% of women are highly empowered, and 4.0 percentage fall into the low group. Women deciding alone show 69.7% high and 2.0% low empowerment. Employment shows a significant effect on empowerment. Among currently working women, 82.4% are highly empowered and 1.6% are low. Non-working women show 71.1% high and 1.9% low. Pre-marriage employment results in 79.7% high empowerment, versus 74.0% among those without it. Property ownership shows no significant association with empowerment (p > 0.05). Women owning a house alone report 81.0% high empowerment; those without ownership show 74.3%, and joint owners show 75.6%. Landowners show 81.3% high empowerment, compared to 74.2% among non-owners. Low empowerment stays under 3.0% overall but rises with no education, rural residence, assetlessness, and male-only decision-making. High empowerment dominates, but structural barriers persist across key areas.
Table 3 presents the regression results, summarizing odds ratios and statistical significance for predictors of women’s empowerment, highlighting the impact of indicators on empowerment levels.
Discussion
This study analyzed key predictors of women’s empowerment using the BDHS 2022 dataset. Results show that 74.5% of Bangladeshi women are highly empowered, 23.7% moderately empowered, and 1.8% have low empowerment. Age, education, employment, media access, reproductive decision-making, and property ownership emerged as strong predictors of empowerment, whereas wealth and place of residence showed weaker or more nuanced associations. Empowerment rises significantly with age. Compared to adolescents (15–19 years), women in older age groups show progressively greater empowerment, peaking at 3.31 times higher odds for those aged 40–44 years. This suggests that empowerment accumulates over time through increased experience, authority, and household roles. These findings support earlier research showing older women exercise more influence in decision-making [6]. Education consistently enhances empowerment. Women with secondary education had 43% greater odds, and those with higher education were nearly twice as likely to be empowered as those with no education. This reinforces evidence that education improves women’s autonomy and access to information and services [3,5,8]. However, primary education did not significantly increase empowerment, underscoring the need for education beyond the basic level. Husbands’ education had a marginal negative effect; higher-educated husbands reduced women’s odds of empowerment by 23%, possibly due to increased male dominance. Yet, in rural areas, this was reversed, with educated husbands associated with 37% higher odds, likely reflecting more support in rural contexts [7]. Employment plays a critical role. Women currently working were over twice as likely to be empowered, affirming that employment fosters agency (M. E. Haque & Sarkar, 2021). However, the benefit was smaller for rural women, suggesting that informal, low-paid rural jobs offer less empowerment [1]. The lack of significance for pre-marital employment implies that present economic involvement is more influential than previous exposure.
Regionally, women in Dhaka and Chattogram had significantly higher empowerment than those in Barishal, while Sylhet had the lowest rate of high empowerment and the highest rates of medium and low empowerment. This reflects regional disparities in gender norms, service access, and women’s mobility [5]. Despite urban women showing marginally greater empowerment, place of residence did not significantly predict empowerment, highlighting those structural inequalities, particularly in education and media access, play a more critical role than geographic location [3]. Reproductive decision-making had a major influence. Women who made joint decisions with their husbands on contraceptive use were 91% more likely to be empowered, while those whose husbands decided alone were 61% less likely. These findings align with Kabir, who observed that joint decision-making fosters mutual respect and greater health service use. Empowered women also showed greater engagement in maternal health [10], indicating that reproductive autonomy drives broader wellbeing.
Media exposure, particularly watching TV and reading newspapers, had a significant positive effect. Women exposed to media weekly had higher empowerment levels than those with no access. This supports the idea that the media expands awareness of rights and opportunities [5,14]. Radio exposure had no effect, likely due to its minimal reach (1.2%). Asset ownership produced mixed results. Land ownership, whether sole or joint, was strongly associated with higher empowerment, though this likely reflects a small, distinct subgroup. Other ownership types, including joint ownership with a husband, showed no significant effects. These findings suggest that formal ownership does not guarantee decision-making power, especially in male-headed households [7,8]. Very few women owned property independently, highlighting that asset control is one of the slowest-moving aspects of empowerment. The wealth index, although often emphasized in development frameworks, did not significantly predict empowerment once other variables were controlled. While raw figures showed that wealthier women had slightly higher empowerment, this effect disappeared in the adjusted model. This suggests that financial status alone is insufficient without parallel gains in education, decision-making, and autonomy (Akter et al.; Md Enamul Haque & Sarkar) [5]. Women facing overlapping disadvantages, such as lack of media access, unemployment, and no asset ownership, were the most likely to experience low empowerment. In rural settings, these intersecting factors accounted for 86.6% of cases classified as low empowerment. This confirms that empowerment depends on the interaction of multiple barriers across social, economic, and informational domains [13,14]. Despite notable progress, key barriers to women’s empowerment in Bangladesh persist, particularly for younger, less educated, economically inactive, and socially isolated women. Education, employment, reproductive autonomy, and media exposure were the most influential drivers, while wealth and residence had limited impact after adjustment. These findings underscore the need for integrated strategies that address both structural and social dimensions to ensure inclusive and sustained empowerment.
Limitations
This study has a few limitations. First, it relies solely on data from women in the BDHS, which may introduce sampling or reporting biases. Second, women's empowerment was measured using only two indicators, household decision-making and attitudes toward wife-beating. A more comprehensive assessment could include additional dimensions such as economic decision- making, access to healthcare, physical mobility, family planning autonomy, and ownership of assets. Furthermore, as the BDHS dataset is cross-sectional, causal relationships cannot be established; only associations can be inferred. Lastly, due to data limitations, some important covariates were excluded. To maintain data quality, we included only variables with less than 35% missing values, ensuring at least 65
Conclusion
Women’s empowerment in Bangladesh has progressed, with 74.5% highly empowered and only 1.8% low empowered. Empowerment rises with age; women aged 40–44 years are over three times more likely to be empowered than adolescents. While higher education has a strong impact, primary education shows a limited effect. Husband’s education has mixed effects, increasing empowerment in rural areas but slightly reducing it overall. Employment, reproductive autonomy, and joint decision-making are strong empowerment predictors; pre-marital employment has no enduring influence. Urban women benefit more from employment and media access; rural women gain more from spousal education and land ownership. Media exposure, especially through TV and newspapers, is crucial, though 30% of women lack access. Sylhet division lags with the highest low/medium empowerment rates. Addressing these disparities requires integrated interventions like FSSAP, PKSF, Joyeeta, community radio, mobile education, health incentives, legal aid, and gender-responsive budgeting to improve access, economic participation, and decision-making.
Declarations
Ethical Statement
This study is based on publicly available, anonymized secondary data from the 2022 BDHS. Ethical approval for data collection was granted by the Bangladesh Medical Research Council (BMRC) and the ICF Institutional Review Board. No additional ethical clearance was required for this analysis.
Acknowledgement
This analysis uses publicly available data from the 2022 Bangladesh Demographic and Health Survey (BDHS). The authors gratefully acknowledge the Demographic and Health Surveys (DHS) Program for providing data access. We also extend our sincere gratitude to the anonymous reviewers for their constructive feedback and to the editorial team for their guidance, which greatly improved the clarity and rigor of this work.
Data Availability
The data used in this study are publicly available through the DHS Program website (https://dhsprogram.com), subject to registration and approval. The authors obtained permission and complied with all relevant conditions.
Competing Interest
The authors declare that they have no known competing financial interests or personal relationships that could have appeared to influence the work reported in this paper.
References
- Hossain, D., Islam, M. A., & Majumder, S. (2016). Influences of micro-credit programmes on women empowerment in Bangladesh. Journal of the Bangladesh Agricultural University, 14:93–100.
Publisher | Google Scholor - Bayeh, E. (2016). The role of empowering women and achieving gender equality to the sustainable development of Ethiopia. Pacific Science Review B: Humanities and Social Sciences, 2:37–42.
Publisher | Google Scholor - Tabassum, M., Begum, N., Rana, M. S., Faruk, M. O., & Miah, M. M. (2019). Factors influencing women’s empowerment in Bangladesh. Science, Technology & Public Policy, 3:1–10.
Publisher | Google Scholor - World Economic Forum. (2021). Global gender gap report 2021. World Economic Forum.
Publisher | Google Scholor - Akter, S., Hosen, M. S., Khan, M. S., & Pal, B. (2024). Assessing the pattern of key factors on women’s empowerment in Bangladesh: Evidence from Bangladesh Demographic and Health Survey, 2007 to 2017–18. PLOS ONE, 19:e0301501.
Publisher | Google Scholor - Paul, G. K., Sarkar, D. C., & Naznin, S. (2016). Present situation of women empowerment in Bangladesh. International Journal of Mathematics and Statistics Invention.
Publisher | Google Scholor - Shahen, M. A., Jahan, M. N., Ahmed, R., & Islam, M. T. (2020). Women empowerment in family life of Bangladesh: An analytical study. IOSR Journal of Humanities and Social Science, 25:11–21.
Publisher | Google Scholor - Sen, K. K., & Nilima, S. (2018). Women’s empowerment and its determinants in Bangladesh: Evidence from a national survey. Dhaka University Journal of Science.
Publisher | Google Scholor - Haque, M. E., & Sarkar, D. C. (2021). Demographic and socio-economic determinants of women employment in Bangladesh. International Journal of Innovative Technologies in Economy.
Publisher | Google Scholor - Anik, A. I., Ghose, B., & Rahman, M. M. (2021). Relationship between maternal healthcare utilisation and empowerment among women in Bangladesh: Evidence from a nationally representative cross-sectional study. BMJ Open, 11:e049167.
Publisher | Google Scholor - Jennings, L., Na, M., Cherewick, M., Hindin, M., Mullany, B., & Ahmed, S. (2014). Women’s empowerment and male involvement in antenatal care: Analyses of Demographic and Health Surveys in selected African countries. BMC Pregnancy and Childbirth, 14:297.
Publisher | Google Scholor - Kabir, M. A., Alam, M. B., Khanam, S. J., Hassen, M. T., & Khan, M. N. (2024). Association between women’s empowerment and modern contraception uptake in Bangladesh: Evidence from Bangladesh Demographic and Health Survey. Research Square (Preprint).
Publisher | Google Scholor - Khanam, S. J., Alam, M. B., & Khan, M. N. (2023). Association between women’s empowerment and diarrhea in children under five years in Bangladesh: A nationally representative study. Research Square (Preprint).
Publisher | Google Scholor - Islam, M., Ahmed, M. S., & Mistry, S. K. (2021). Factors associated with women’s approval of intimate partner violence in Bangladesh: A cross-sectional analysis of the latest Demographic and Health Survey 2017–18. Heliyon, 7:e08582.
Publisher | Google Scholor - Stöckl, H., Hassan, A., Ranganathan, M., & Hatcher, A. M. (2021). Economic empowerment and intimate partner violence: A secondary data analysis of the Demographic and Health Surveys in Sub-Saharan Africa. BMC Women’s Health, 21:136.
Publisher | Google Scholor - Haque, M. M., Islam, T. M., Tareque, M. I., & Mostofa, M. G. (2011). Women empowerment or autonomy: A comparative view in Bangladesh context. Bangladesh e-Journal of Sociology.
Publisher | Google Scholor - Agresti, A. (2007). An introduction to categorical data analysis (2nd ed.). Wiley.
Publisher | Google Scholor - Han, J., Kamber, M., & Pei, J. (2011). Data mining: Concepts and techniques (3rd ed.). Morgan Kaufmann.
Publisher | Google Scholor - Hosmer, D. W., & Lemeshow, S. (2000). Applied logistic regression (2nd ed.). Wiley.
Publisher | Google Scholor - Ananth, C. V., & Kleinbaum, D. G. (1997). Regression models for ordinal responses: A review of methods and applications. International Journal of Epidemiology, 26(6):1323–1333.
Publisher | Google Scholor - Norton, E. C. (2004). Computing interaction effects and standard errors in logit and probit models. The Stata Journal, 4(2):154–167.
Publisher | Google Scholor