
Research Article
Spectral Analysis of Arterial System Resonance
1Instituto de Investigaciones Científicas y Tecnológicas en Electrónica, UNMDP/ CONICET, Argentina.
2Unidad de Hipertensión Arterial, Servicio de Clínica Médica, Hospital Italiano de Buenos Aires, Argentina.
3Unidad de Hipertensión Arterial, Instituto Prometeo, Mar del Plata, Argentina.
4Unidad de Cardiología, Clínica 25 de Mayo, Mar del Plata, Argentina.
*Corresponding Author: Fernando Mario Clara, Instituto de Investigaciones Científicas y Tecnológicas en Electrónica, UNMDP/ CONICET, Argentina.
Citation: Clara F.M., Alfie J., Blanco G., Casarini A. (2025). Spectral Analysis of Arterial System Resonance, Journal of Clinical Cardiology and Cardiology Research, BioRes Scientia Publishers. 4(2):1-8. DOI: 10.59657/2837-4673.brs.25.049
Copyright: © 2025 Fernando Mario Clara, this is an open-access article distributed under the terms of the Creative Commons Attribution License, which permits unrestricted use, distribution, and reproduction in any medium, provided the original author and source are credited.
Received: March 07, 2025 | Accepted: April 21, 2025 | Published: May 01, 2025
Abstract
Introduction: The Windkessel model simulates the radial pulse wave. When the aortic valve closes, instead of a pressure decrease during diastole, there is an initial increase due to a resonant response. The aim of this study was to explain this phenomenon based on the spectral analysis, and determine how it is affected by aging.
Methods: The Fourier spectrum of resting pressure wave was analysed in a healthy set of 49 young individuals (26.9±7.3 years) and 51 adults (53.4±10.3 years). To explain the results, the Windkessel was considered a low-pass filter composed by distal compliance Cd, aortic inertance L, and peripheral resistance Rp.
Results: The spectrum obtained showed a maximum amplitude between 3 and 4 Hz, evidencing resonant behavior in that frequency range. Linear regression of diastolic pressure increases revealed that it depends mainly on the amplitude of the 3rd harmonic of the spectrum (p<0.001), for normal heart rate values.
Conclusions: The arterial system resonates at a frequency close to 3.5 Hz, generating the oscillation responsible for the diastolic pressure increase. The resonance frequency remains constant with age, however, the oscillation amplitude, related to small distal artery compliance and endothelial dysfunction, decreases by more than 50%. The resonant configuration of the arterial system results from an evolutionary development that allows diastolic pressure to be increased for approximately 300 ms, using the energy stored during systole. Spectral analysis allows the assessment of aging of the arterial system, and could be useful in evaluating the effects of cardiometabolic diseases on small arteries.
Keywords: radial pulse wave; spectrum; diastolic oscillation; arterial aging
Introduction
Any signal periodic in time, such as a pulse wave, can also be represented as a function of frequency based on its spectral components, called the Fourier spectrum. Representations in the time or frequency domains describe different characteristics of the same physical phenomenon. Figure 1 shows the pulse wave (PW) recording of a healthy young individual (Age 23) and its corresponding Fourier spectrum, with a heart rate of 66 bpm (1.1 Hz). The PW consists of a systolic wave and a diastolic wave (DW), separated by the dicrotic notch which indicates the closure of the aortic valve. The spectrum shows the amplitudes of the fundamental component, the heart rate, and harmonics.
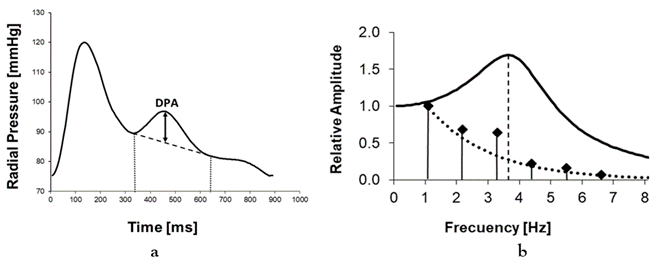
Figure 1: a: Pulse wave of a young subject. The initial amplitude of the pressure increase (DPA) in the damped oscillation is indicated, with a period of approximately 300 ms. b: Fourier spectrum and Windkessel response. The corresponding spectrum (vertical bars) indicates a heart rate of 1.1 Hz. The third harmonic, located at 3.3 Hz, exhibits a prominent amplitude. The solid line represents the Windkessel frequency response, showing a peak at 3.7 Hz. The dotted line represents the spectral amplitude when the Windkessel frequency response is flat.
After the valve opens, the increased pressure in the DW improves tissue perfusion during diastole. The amplitude of the pressure increases during diastole (DPA), indicated in Figure 1a, is directly related to the elasticity of the small distal arteries [1,2]. The reduction in DPA with age is a direct consequence of endothelial dysfunction affecting distal arteries, which begins at a very early age [3,4]. The morphology of the DW is explained by the four-element Windkessel (WK) model, which describes the shape of the variation of pressure on peripheral resistance during diastole when aortic compliance discharges the pressure accumulated through the aorta [2,5]. Figure 2 presents the schematic of the electrical version of the WK, which includes a large capacitor Ca representing the compliance of the proximal aorta, a small capacitor Cd, representing the compliance of the distal arteries, the peripheral resistance Rp, and an inductor L, representing the inertance of the fluid column. Only the diastolic phase is considered, with the aortic valve closed and the ventricle relaxing.
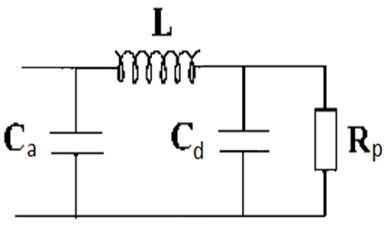
Figure 2: Four-element Windkessel electrical model of the arterial system. It includes peripheral resistance (Rp), aortic compliance (Ca), distal compliance (Cd), and the inertance (L) of the aortic fluid column separating them. The model describes the voltage drop across Rp caused by the discharge of Ca after the closure of the aortic valve.
In the hydraulic interpretation of the model, the pressure accumulated in Ca during systole generates aortic flow through L, which produces pressure variations over Rp, recorded as the radial pulse wave. The electrical version represents flows as currents and pressures as voltages. The units of Cd are expressed directly in Farads, L in Henrys, and Rp in Ohms, with the same absolute values as the hydraulic units. The model's output consists of the voltage variations over Rp, simulating the radial pulse wave. The Fourier spectrum of the pulse wave consists of a set of bars representing the amplitudes of a fundamental component with a frequency equal to the heart rate, and its harmonics, which are multiples of it [6]. The sum of all these senoidal components reconstructs the original pulse wave, which explains why both the frequency spectrum and the time-domain record contain similar information about the phenomenon under study. Additionally, the WK model behaves electrically as a low-pass LCR filter type, accentuating certain spectral components and eliminating others above a cut off frequency, which determines the pulse wave morphology [7]. Therefore, the spectral analysis of an individual's radial pulse wave allows for inference into their WK characteristics. This study aimed to explain the characteristics and evolution with age of the diastolic oscillation responsible for the increase in distal pressure, using Fourier spectral analysis and considering the WK as a low-pass LCR filter.
Materials and Methods
The study was conducted on a group of 100 healthy males aged between 18 and 65 years, divided into a young group (mean age = 26.9±7.3 years, N=49) and an adult group (mean age = 53.4±10.3 years, N=51). Our study complies with the Declaration of Helsinki, and was approved by the Research Ethics Committee of the National University of Mar del Plata (Code NO- 2021-31009786-GDEBA-DPEGSFFMSALGP). Pulse wave recordings for these subjects were previously collected following bioethical standards, using a piezoelectric sensor (Murata 7BB-12-9) placed on the radial pulse palpation area. The sensor output was digitized and acquired with an 8-bit resolution and a 15 Hz bandwidth. Brachial blood pressure was measured after a 15-minute resting period in a sitting position with an automatic blood pressure monitor (Omrom, HEM-7120), using the average of three readings take at 1 min intervals.
The recordings were processed using Mathcad 7, which includes signal processing capabilities. The eight cardiac cycles with the highest correlation were averaged, and the average was plotted as pressure variations, based on the systolic and diastolic pressures. In each recording, the diastolic pressure augmentation was measured as illustrated in Figure 1a, and Fourier spectral analysis was applied. In addition, the frequencies and amplitudes of the most significant harmonics were measured relative to the amplitude of the fundamental component of the heart rate. The obtained spectra were interpreted considering the WK model as a resonant low-pass filter, whose operational equations are well-known and commonly used in signal processing. The pulse wave spectrum S(f), such as the example in Figure 1b, mainly contains components generated during systolic ejection. Seven spectrum points were considered, corresponding to the zero frequency and the first six harmonics. To obtain the specific spectral components of the diastolic oscillation, the following procedure was carried out.
The oscillatory component of the pulse wave was eliminated, reducing the diastole to a simple exponential decay, and the corresponding spectrum So(f) was obtained, represented in Figure 1b as a dashed line. The spectrum S(f) and So(f) were subtracted, and were obtained 7 points corresponding to the isolated diastolic oscillation spectrum amplitudes, affected by the WK filtering effect. Based on these, the frequency at which the amplitude response is maximal must be obtained. To obtain the envelope of these 7 points, a 6th-order Lagrange interpolation was applied, producing a continuous graph. The frequency corresponding to the maximum amplitude of the spectrum (fmx), was determined using the zero-crossing of the first derivative of the function. The value obtained is close to the WK resonance frequency. The amplitude of the pressure increase DPA was measured as graphically illustrated in Figure 1a. Statistical analysis was performed using MATLAB® (MathWorks, Natick, MA, USA). Based on the Lilliefors test results, normal data distribution was not assumed. The Wilcoxon test was used to compare the studied variables. Results are expressed as means ± standard deviation (SD). A p-value lessthan 0.05 was considered statistically significant. Multiple regression was used to perform the linear model.
Results
The total population presented an average hearth rate of 71.4±11.4 bpm (1.19±0.19 Hz), with the Shapiro-Wilk test indicating a normal distribution (W=0.97, p=0.17). Figure 3 shows the values obtained for fmx as a function of age for each individual, and the corresponding regression line. The correlation between both variables was weak (R2=0.058), with considerable dispersion. The slope of this line indicates that fmx increases by 0.045 Hz/decade, and its average values between 18 and 70 years vary between 3.4 and 3.6 Hz. No young person presented fmx greaterthan 4Hz and no older adult presented fmx lessthan 3Hz.
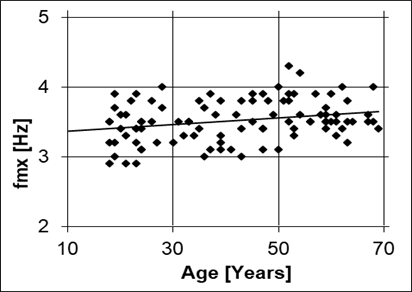
Figure 3: Values of the maximum gain frequency for the Windkessel of each individual (fmx). A slight increase in the average with age is observed, as well as a considerable dispersion.
The diastolic pressure augmentation DPA was measured as illustrated in Figure 1a, with results plotted against age in Figure 4.
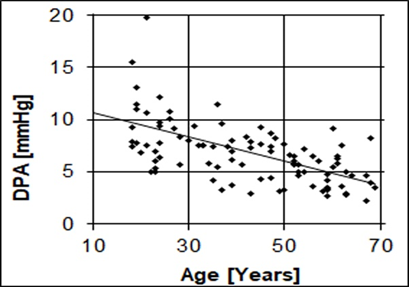
Figure 4: Variation of diastolic pressure augmentation as a function of age. The increase in pressure at the onset of diastole decreases with aging but persists even in advanced age.
The Shapiro-Wilk test indicated an average DPA of 6.5±2.8 mmHg, with a non-normal distribution (W=0.93, p lessthan 0.001). Young individuals under 20 years of age presented a DPA of 9.2 ± 2.2 mmHg, and adults over 60 years a DPA of 4.6 ± 1.4 mmHg, with considerable dispersion. The DPA decline rate with age was 0.11 mmHg/year (R²=0.42). The relative amplitudes of the three main harmonics decreased with age. Between 18 and 65 years, A2nd decreased from 73% to 54%, A3rd from 57% to 31%, and A4th from 29% to 14%. Differences in harmonic amplitude distribution were observed even among individuals of similar age and condition. The DPA variable quantifies the pressure increase during diastole and is directly related to distal compliance [8]. Due to the importance of this variable, its dependence on harmonic content was studied by linear regression, including the variables "Age" and "Heart Rate", which could also affect it. The results shown in Table 1 confirm that DPA depends mainly on 3rd harmonic being independent of other harmonics and heart rate.
Table 1: Linear regression of the DPA variable. A2nd, A3rd, A4th: Second, third and fourth harmonic amplitudes of the pulse wave spectrum, relative to the amplitude of the fundamental component fc. Only the variables A3rd and Age were significant.
| DPA Regression | Statistical F= 18.1 | p-Value < 10> | Adjusted R2 = 0.59 |
| Variable | B Coefficients | t-Statistic | Probability |
| Age | -0.047 | -2.24 | 0.03 |
| A2nd | 0.019 | 0.90 | 0.37 |
| A3rd | 0.113 | 4.54 | lessthan 0.001 |
| A4th | 0.008 | 0.22 | 0.83 |
| fc | -0.016 | -0.01 | 0.99 |
| Interception | 2.344 | 0.95 | 0.35 |
In elderly individuals, frequency components between 5 and 10 Hz were observed in the spectrum related to the width of the systolic wave, but not with the diastolic oscillation. In this age group, both the diastolic pressure increases and the amplitudes of harmonics 2nd and 3rd were minimal. At frequencies above 10 Hz the amplitude of all spectral components was virtually zero.
Discussion
When a second-order underdamped system is subjected to a pulsatile input, such as the systolic ejection, the cessation of the input generates a damped oscillatory response. In the circulatory system, the closure of the aortic valve initiates diastole. The diastolic phase begins at the dicrotic notch and is composed of an exponential decay superimposed on a damped oscillation. The exponential decline is attributed to the discharge of total compliance (C≈ Ca) through peripheral resistance [3].
The damped oscillation arises from a more complex mechanism. The WK model, acting as a low-pass filter, allows low-frequency components of the systolic discharge to pass unaffected while attenuating spectral components above a "natural resonance" frequency (fn) [6]. Given the physiological condition Cd less than Ca, using the filter equations the fn value can be approximated by:

For specific values of L, Cd and Rp, second-order filters generate a type of response known as "underdamped", strongly related to the amplitude of the oscillation. This occurs when the damping coefficient ζ, given by equation (2), is lessthan 1 [6].

In underdamped mode, the output amplitude increases for frequencies near fn, as observed in the spectrum in Figure 1b. The result is the appearance of a damped oscillation in the time domain when a pulsating input, such as ventricular discharge, is applied to the filter. This is precisely what is observed in Figure 1a during diastole.
The voltage (pressure) gains of the WK as a function of input frequency (f), called “transference function” H(f), is given by:

In underdamped systems, H(f) exhibits maximum gain at a frequency called fmx, slightly lower than fn. For ζ lessthan 0.2 fmx and fn are nearly equal. The oscillation period is mainly determined by the harmonic component of the systolic discharge close to fmx.
If ζ lessthan 1, the maximum transfer gain is verified at fn and is given by:

The diastolic pressure augmentation depends on the square root of the Cd/L ratio. Based on our results, the average fmx is 3.5 Hz, corresponding to a period of 290 ms. As fmx remains approximately constant with aging, it is reasonable to assume that the 300 ms period during which pressure increases at the beginning of diastole could represent an optimal resting value. In individuals with a normal heart rate (fc = 1.2 Hz or 72 bpm), the third harmonic is located at 3.6 Hz, closely matching fmx, and thus becomes the most amplified. For other values of fc, the system behaves similarly, with the harmonic closest to fmx being the most amplified.
The time taken for the oscillation to attenuate to 37% of its initial value is called the "Time constant" (τ), and is given by:

If τ is shorter than the oscillation period, it nearly extinguishes in the next cycle, a situation observed in the diastolic portion of Figure 1a. To verify whether the above expressions fit the results observed in a particular case, such as that in Figure 1, the exact values of L, Cd and Rp must be known. However, calculating the WK elements is challenging, as it requires solving a system of equations with multiple unknowns [1]. Various authors have reported different values for these elements, likely due to the uncertainty of estimating Rp based on cardiac output obtained through an empirical expression. Reported values include Ca between 1.1 and 2 mL/mmHg, Cd between 0.02 and 0.19 mL/mmHg, L between 0.01 and 0.03 mmHg/[mL/s2], and Rp between 0.6 and 1.5 mmHg/[mL/s] [1-3]. Using equation (2), it is found that for almost the entire range of physiological values results ζ lessthan 1, indicating that the WK always operates in an underdamped mode. This explains why damped oscillations are observed in almost all pulse wave records, increasing pressure as the aortic valve closes.
Considering the following values for a young individual (Rp = 0.6 ohms, L = 0.014 Hy, Cd = 0.12 F and Ca greaterthan Cd), and applying them to equations (1-3) and (5), considering fc = 1.1 Hz, the following approximate results are obtained: fn=3.8 Hz; fmx= 3.6 Hz; G(3.fc)=1.9; ζ =0.25; τ =0.07 s. These values indicate that the system is underdamped (ζ lessthan 1) and that the filter response will exhibit a gain of 1.9 times at a frequency of 3.3 Hz. Additionally, upon valve closure, the oscillation has a period near 0.30 s, corresponding to the 3rd harmonic of fc, and its amplitude will decrease by 37% at the end of the first period, after 0.07 s. These features are consistent with those shown in the example in Figure 1. The results indicate that applying the equations of a low-pass filter using physiological values of the WK model produces outcomes consistent with the observed pulse wave and spectral recordings, such as the example of the young individual in Figure 1. However, it does not explain why fmx remains approximately constant with aging.
Aging
Previous studies have reported a decline in distal arterial compliance Cd with aging, attributed to the increased arterial stiffness [1,3]. This phenomenon results from a cascade of processes that begins with heightened vascular smooth muscle tone and culminates in arterial wall remodeling. Aging reduces mitochondrial efficiency, leading to elevated reactive oxygen species (ROS) production. Simultaneously, the antioxidant defense system weakens, resulting in oxidative damage to cellular proteins and lipids. Specifically, low-grade systemic endothelial inflammation ("inflammaging") develops [9,10], impairing nitric oxide-mediated vasodilation and causing a predominance of vasoconstrictor tone in smooth muscle, which reduces compliance in distal arteries [11,12]. Persistent vascular smooth muscle activation increases functional stiffness, a phenomenon reversible with nitric oxide donor vasodilators such as nitroglycerin (NTG). NTG temporarily relaxes smooth muscle, enhancing distal compliance and diastolic pressure [13,14]. Chronic inflammation induces intima-media hypertrophy via the proliferation of vascular smooth muscle cells (VSMCs) and extracellular material deposition, resulting in structural stiffness through arterial wall remodeling [15]. These findings align with McVeigh et al. (1999), who reported a 75% reduction in Cd between the ages of 20 and 70. The increased stiffness due to remodelling, combined with increased vasoconstrictor tone, explains the low distal pressure amplitude (DPA) values we have observed in older adults, attributable to decreased Cd [4]. However, the resonance frequency depends on the relationship between inertance and compliance, as defined by equation (1). For fn to remain constant despite declining Cd, L would need to increase due to its inverse dependence on the product L*Cd.
In the WK model for radial pulse wave analysis inertance L represents the pressure required to accelerate the aortic fluid column along the arterial section including the aortic arch, popliteal, brachial, and radial arteries. Inertance depends on the length of a tube and inversely on the square of its diameter. However, there is no evidence of increased L with age in the arm's arterial segment. Conversely, increases in the radial diameters (van der Heijden-Spek, 2000), popliteal, and brachial arteries (Green, 2010) have been reported, which tend to reduce L with aging [16,17]. The constancy of fmx is evident in pulse wave recordings, as the oscillation period in both young and older adults is always close to 300 ms. The spectra always show an amplitude increase near 3.5 Hz, compared to the adjacent components. Since the WK model cannot fully explain this observation, it suggests the arterial system behaves according to a more complex model, such as that proposed by Schumacher et al. (2018) [18]. Nonetheless, the WK model effectively provides a basic explanation for the presence and characteristics of oscillations. Although the resonance frequency remains near 3.5 Hz with aging, the amplitude of the nearest spectral component is a critical indicator as it depends on Cd, and determines the magnitude of the diastolic pressure rise (equation 5). Aging or cardiometabolic diseases reduce nitric oxide production, increase vasoconstrictor tone, and induce arterial remodelling, all contributing to lower Cd [19]. However, peripheral resistance tends to increase with age due to structural and functional changes, such as reduced endothelial vasodilation, arterial wall thickening, and fewer arterioles supplying skeletal muscle [20,21].
According to equation (5), the maximum gain of the WK model decreases with a reduced Cd /L ratio, but is partially compensated by increased Rp. Consequently, the WK model preserves oscillation frequency with aging while moderating amplitude loss. This behaviour is observed in Figure 3b, where diastolic pressure increases persist in older adults. Figure 5, which corresponds to a healthy 66-year-old male, provides an example of this situation. The pulse waveform shows a reduced DPA value, with a duration of around 300 ms, and the spectrum shows a low amplitude maximum close to the 3rd harmonic, located in 3.2 Hz.
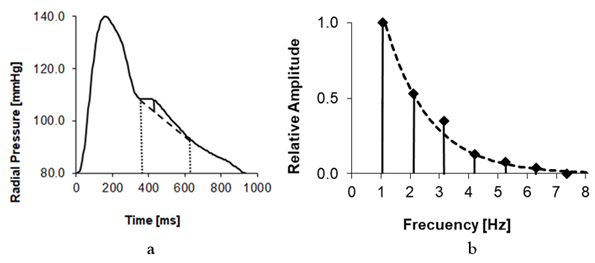
Figure 5: a: Pulse wave of an older adult. A low amplitude pressure increase is observed for approximately 300 ms. b: Corresponding Fourier spectrum. The 3rd harmonic, located at 3.2 Hz, shows a weak increase in amplitude in relation to the flat response.
Clinical Applications
Pulse wave analysis provides insights into the resonant behaviour of the WK model, which determines pulse wave morphology during diastole. The harmonic frequency amplitude distribution is unique to each individual and depends on the interaction between L, Cd and Rp. The pulse wave spectrum is influenced by aging, which increases arterial wall inflammation, reduces distal compliance, and raises peripheral resistance. However, these effects are also characteristic of cardiometabolic diseases. Hypertension exacerbates endothelial stress through mechanical strain, hormonal activation, oxidative stress, and other pathways, leading to inflammation and dysfunction [22]. Dyslipidemia contributes to arterial inflammation through the accumulation of oxidized LDL, a highly atherogenic molecule that induces endothelial dysfunction, increases vascular permeability, and promotes infiltration of lipoproteins and inflammatory cells into the arterial intima [23]. Chronic hyperglycemia elevates reactive oxygen species production, enhances adhesion molecule expression, releases proinflammatory cytokines, and reduces nitric oxide availability [24]. A common feature of these conditions is their contribution to endothelial dysfunction beyond that caused by natural aging, affecting the elements of the WK model [25]. Spectral analysis could therefore serve as an alternative method to assess the effects of aging and cardiometabolic diseases on the arterial system. While calculating L and Cd from time-domain pulse wave recordings is complex and imprecise due to the need to estimate Rp, spectral analysis allows inferences based on fmx and spectral amplitudes measurements.
Conclusion
Spectral analysis of the pulse wave revealed that the arterial system exhibits a resonance near 3.5 Hz. The amplitude of this resonance is primarily determined by the component closest to this frequency, which corresponds to a period of 300 ms. Under normal heart rate conditions, the third harmonic of the fundamental frequency was identified as the most amplified component. Consequently, the increase in diastolic pressure was significantly correlated exclusively with the amplitude of the third harmonic. The resonance frequency tends to remain relatively constant with aging, potentially through an unidentified compensatory mechanism. As a result, opening the aortic valve causes an increase in pressure for approximately 300 ms, which could be optimal under resting conditions. The increase in pressure decreases with age due to a reduction in resonance gain, which affects the spectrum as a lower amplitude of the third harmonic. The phenomena described are primarily influenced by the compliance of small distal arteries, which decreases early in the progression of cardiometabolic diseases. Consequently, spectral analysis may be a valuable tool for early diagnosis, even before clinical symptoms appear. Finally, the arterial system's resonance mechanism could be a physiological adaptation that enables an increase in diastolic pressure for approximately 300 ms by utilizing the energy stored during systole.
References
- Segers, P., Qasem, A., De Backer, T., Carlier, S., Verdonck, P., et al. (2001). Peripheral “Oscillatory” Compliance is Associated with Aortic Augmentation Index. Hypertension, 37(6):1434-1439.
Publisher | Google Scholor - Wang, L., Xu, L., Zhou, S., Wang, H., Yao, Y., et al. (2017). Design and Implementation of a Pulse Wave Generator Based on Windkessel Model Using Field Programmable Gate Array Technology. Biomedical Signal Processing and Control, 36:93-101.
Publisher | Google Scholor - McVeigh, G. E., Bratteli, C. W., Morgan, D. J., Alinder, C. M., Glasser, S. P., et al. (1999). Age-Related Abnormalities in Arterial Compliance Identified by Pressure Pulse Contour Analysis: Aging and Arterial Compliance. Hypertension, 33(6):1392-1398.
Publisher | Google Scholor - Tao, J., Liu, D. H., Wang, L. C., Wang, J. M., Wang, Y., et al. (2007). Arterial Elasticity Identified by Pulse Wave Analysis and Its Relation to Endothelial Function in Patients with Coronary Artery Disease. Journal of Human Hypertension, 21(2):149-153.
Publisher | Google Scholor - Goldwyn, R. M., Watt, T. B. (1967). Arterial Pressure Pulse Contour Analysis Via a Mathematical Model for The Clinical Quantification of Human Vascular Properties. IEEE Transactions on Biomedical Engineering, 1:11-17.
Publisher | Google Scholor - William, H. A. R. T., Kemmerly, J. E., Durbin, S. M. (2007). Engineering Circuit Analysis. McGraw-Hill Higher Education.
Publisher | Google Scholor - Boylestad RL. (2020). Introductory Circuit Analysis.14th ed. Pearson Education.
Publisher | Google Scholor - Clara, F. M., Alfie, J., Scandurra, A., Fita, M. (2023). The Diastolic Oscillation Amplitude Used as an Arterial Aging Indicator. Vascular Health and Risk Management, 193-200.
Publisher | Google Scholor - Zuo, L., Prather, E. R., Stetskiv, M., Garrison, D. E., Meade, J. R., et al. (2019). Inflammaging and Oxidative Stress in Human Diseases: From Molecular Mechanisms to Novel Treatments. International Journal of Molecular Sciences, 20(18):4472.
Publisher | Google Scholor - Franceschi, C., Garagnani, P., Vitale, G., Capri, M., Salvioli, S. (2017). Inflammaging and ‘Garb-Aging’ Trends in Endocrinology & Metabolism, 28(3):199-212.
Publisher | Google Scholor - Lee, S. J., Park, S. H. (2013). Arterial Ageing. Korean Circulation Journal, 43(2):73-79.
Publisher | Google Scholor - Thijssen, D. H., Carter, S. E., Green, D. J. (2016). Arterial Structure and Function in Vascular Ageing: Are You as Old as Your Arteries? The Journal of Physiology, 594(8):2275-2284.
Publisher | Google Scholor - Söderström, S., Sellgren, J., Åneman, A., Pontén, J. (2002). Interpretation of Radial Pulse Contour During Fentanyl/Nitrous Oxide Anesthesia and Mechanical Ventilation. Acta Anaesthesiologica Scandinavica, 46(7):866-874.
Publisher | Google Scholor - Kelly, R. P., Millasseau, S. C., Ritter, J. M., Chowienczyk, P. J. (2001). Vasoactive Drugs Influence Aortic Augmentation Index Independently of Pulse-Wave Velocity in Healthy Men. Hypertension, 37(6):1429-1433.
Publisher | Google Scholor - Xu, X., Wang, B., Ren, C., Hu, J., Greenberg, D. A., et al. (2017). Age-Related Impairment of Vascular Structure and Functions. Aging and Disease, 8(5):590.
Publisher | Google Scholor - Van Der Heijden-Spek, J. J., Staessen, J. A., Fagard, R. H., Hoeks, A. P., Boudier, H. A. S., et al. (2000). Effect of Age on Brachial Artery Wall Properties Differs from The Aorta and Is Gender Dependent: A Population Study. Hypertension, 35(2):637-642.
Publisher | Google Scholor - Green, D. J., Swart, A., Exterkate, A., Naylor, L. H., Black, M. A., et al. (2010). Impact of Age, Sex and Exercise on Brachial and Popliteal Artery Remodelling in Humans. Atherosclerosis, 210(2):525-530.
Publisher | Google Scholor - Schumacher, G., Kaden, J. J., Trinkmann, F. (2018). Multiple Coupled Resonances in The Human Vascular Tree: Refining the Westerhof Model of The Arterial System. Journal of Applied Physiology, 124(1):131-139.
Publisher | Google Scholor - Thijssen, D. H., Carter, S. E., Green, D. J. (2016). Arterial Structure and Function in Vascular Ageing: Are You as Old as Your Arteries? The Journal of Physiology, 594(8):2275-2284.
Publisher | Google Scholor - Jensen, L. J. (2024). Functional, Structural and Proteomic Effects of Ageing in Resistance Arteries. International Journal of Molecular Sciences, 25(5):2601.
Publisher | Google Scholor - Serné, E. H., De Jongh, R. T., Eringa, E. C., IJzerman, R. G., Stehouwer, C. D. (2007). Microvascular Dysfunction: A Potential Pathophysiological Role in The Metabolic Syndrome. Hypertension, 50(1):204-211.
Publisher | Google Scholor - Krzemińska, J., Wronka, M., Młynarska, E., Franczyk, B., Rysz, J. (2022). Arterial Hypertension-Oxidative Stress and Inflammation. Antioxidants, 11(1):172.
Publisher | Google Scholor - Sharma, C., Suliman, A., Al Hamad, S. M., Yasin, J., Abuzakouk, M., et al. (2024). Association of Biomarkers for Dyslipidemia, Inflammation, and Oxidative Stress with Endothelial Dysfunction in Obese Youths: A Case-Control Study. Diabetes, Metabolic Syndrome and Obesity, 2533-2545.
Publisher | Google Scholor - Pouvreau, C., Dayre, A., Butkowski, E. G., De Jong, B., Jelinek, H. F. (2018). Inflammation and Oxidative Stress Markers in Diabetes and Hypertension. Journal of Inflammation Research, 61-68.
Publisher | Google Scholor - Duprez, D. A., Forbang, N. I., Allison, M. A., Peralta, C. A., Shea, S., et al. (2019). Association Of C2, A Derivative of The Radial Artery Pressure Waveform, With New Onset of Type 2 Diabetes Mellitus: The MESA Study. Cardiovascular Diabetology, 18:1-7.
Publisher | Google Scholor